Overview: visibility, position and sentiment
What the dashboards show, how visibility, position and sentiment are counted, and how to read the Overview: the chart, the change against the last period and the split by engine and group.
Updated
On this page
Once a project is tracked, four dashboards show what AI engines answer to your prompts: Overview for the big picture, Prompts for each question, Competitors for who gets named instead of you, and Sources for the pages AI cites. They all read the same answers and use the same three numbers. This article explains those numbers and the Overview.
The three metrics
Every number on the dashboards is one of three, counted over the period you pick:
| Metric | What it answers | How it is counted |
|---|---|---|
| Visibility | How often does AI name you? | Answers that name the brand ÷ all answers in the period. One answer is one engine's reply to one prompt on one run. |
| Position | When it names you, how high? | Your average place among the brands an answer names: #1 is the first brand named. Only answers that name you count, so it never mixes with visibility. Lower is better. |
| Sentiment | How warmly does it talk about you? | Each mention is scored 0–100 (positive, neutral or negative), then averaged over the period. |
Sentiment comes with a coloured dot, the same on every screen:
| Band | Score | What it usually means |
|---|---|---|
| Positive (green) | 65–100 | Recommended, or framed as the one to pick. |
| Neutral (yellow) | 45–64 | Listed and described, not recommended. |
| Negative (red) | 0–44 | Hedged, or ranked behind someone else. |
A dash instead of a number means there is nothing to count: no answer in the period named the brand, so there is no position or tone to average.
Periods and the change
The 7d, 30d and 90d switch at the top of each dashboard sets the period. A number for a period is counted over all of it, not taken from its last day: a day with many answers weighs more than a day with few.
Next to a number, the change compares it with the period of the same length just before, for example +3% with vs 30d. It appears only when tracking covers that earlier period completely; a project tracked for two weeks shows no change on 30d yet. A change too small to matter is not shown at all. Green always means better, so a falling position is green.
Only counted runs go into the numbers: an engine counts on a day when at least half of its answers arrived. See Turn on tracking for run statuses.
The Overview
At the top, three tiles show visibility, position and sentiment for the period. They are also tabs: choose one, and the chart and every list below switch to that metric.
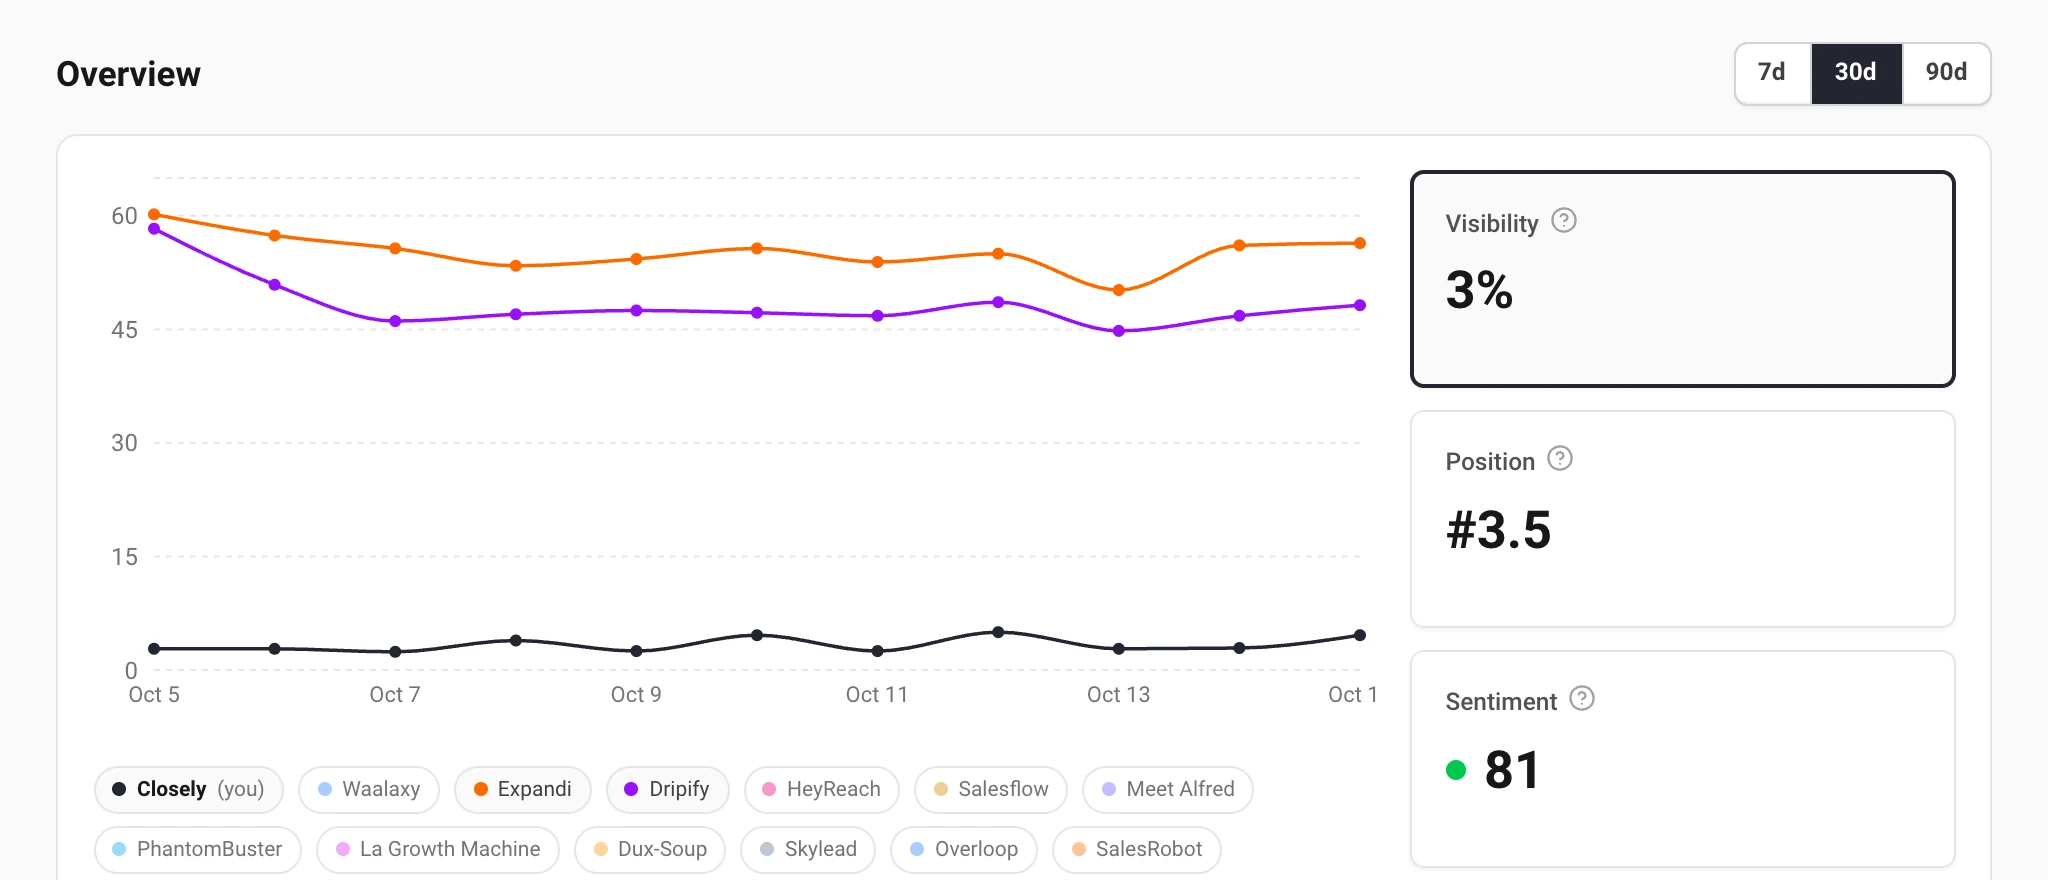
The chart draws your brand and two of your most visible competitors. The chips under it turn any tracked brand's line on or off. Hover a day to see every brand ranked. A day without a counted run leaves a gap in the line rather than a drop to zero: no run is not the same as a bad day.
Right after tracking starts, a note under the chart says how much history there is. Trends need a week or two of runs to mean anything.
By engine and by group
Below the chart, the table lists your prompts with the selected metric, best first. On the right, two lists split the same number:
- By model: the number on each AI engine. Engines differ a lot: you can be named in Google's AI Overviews and missing from ChatGPT.
- By group: the number for each group of prompts, with how many prompts it holds. It appears once the project has groups; see Add, suggest and group prompts.
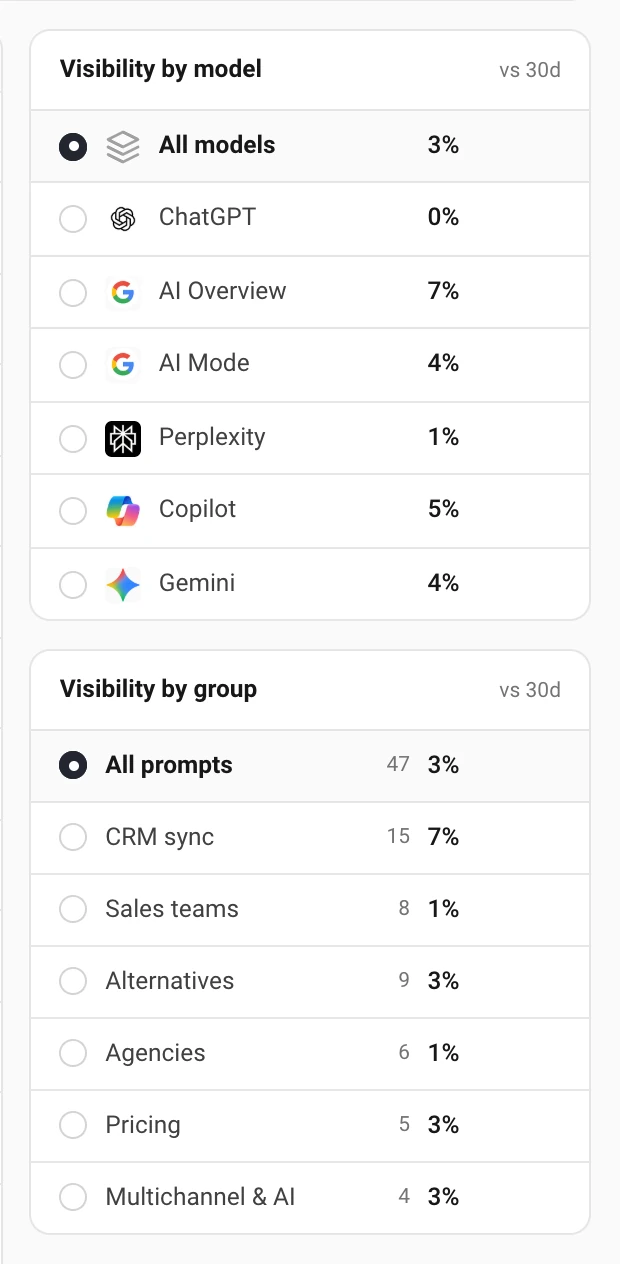
Choosing a row filters the whole Overview to that engine or group: the tiles, the chart and the prompts table. The filter shows as a tag at the top; its cross removes it.
What to do with it
The Overview tells you where to look; the other dashboards tell you why:
- Low visibility on one engine: open Prompts, filter to that engine and read what it answers instead.
- A competitor's line far above yours: open Competitors and see on which prompts they are named and you are not.
- A group that lags behind: the questions in it need content or mentions you do not have yet. Sources shows which pages AI reads for them.
Still have a question?
Write to hello@askwatch.ai. A person answers.