AI Visibility Index: September 2026
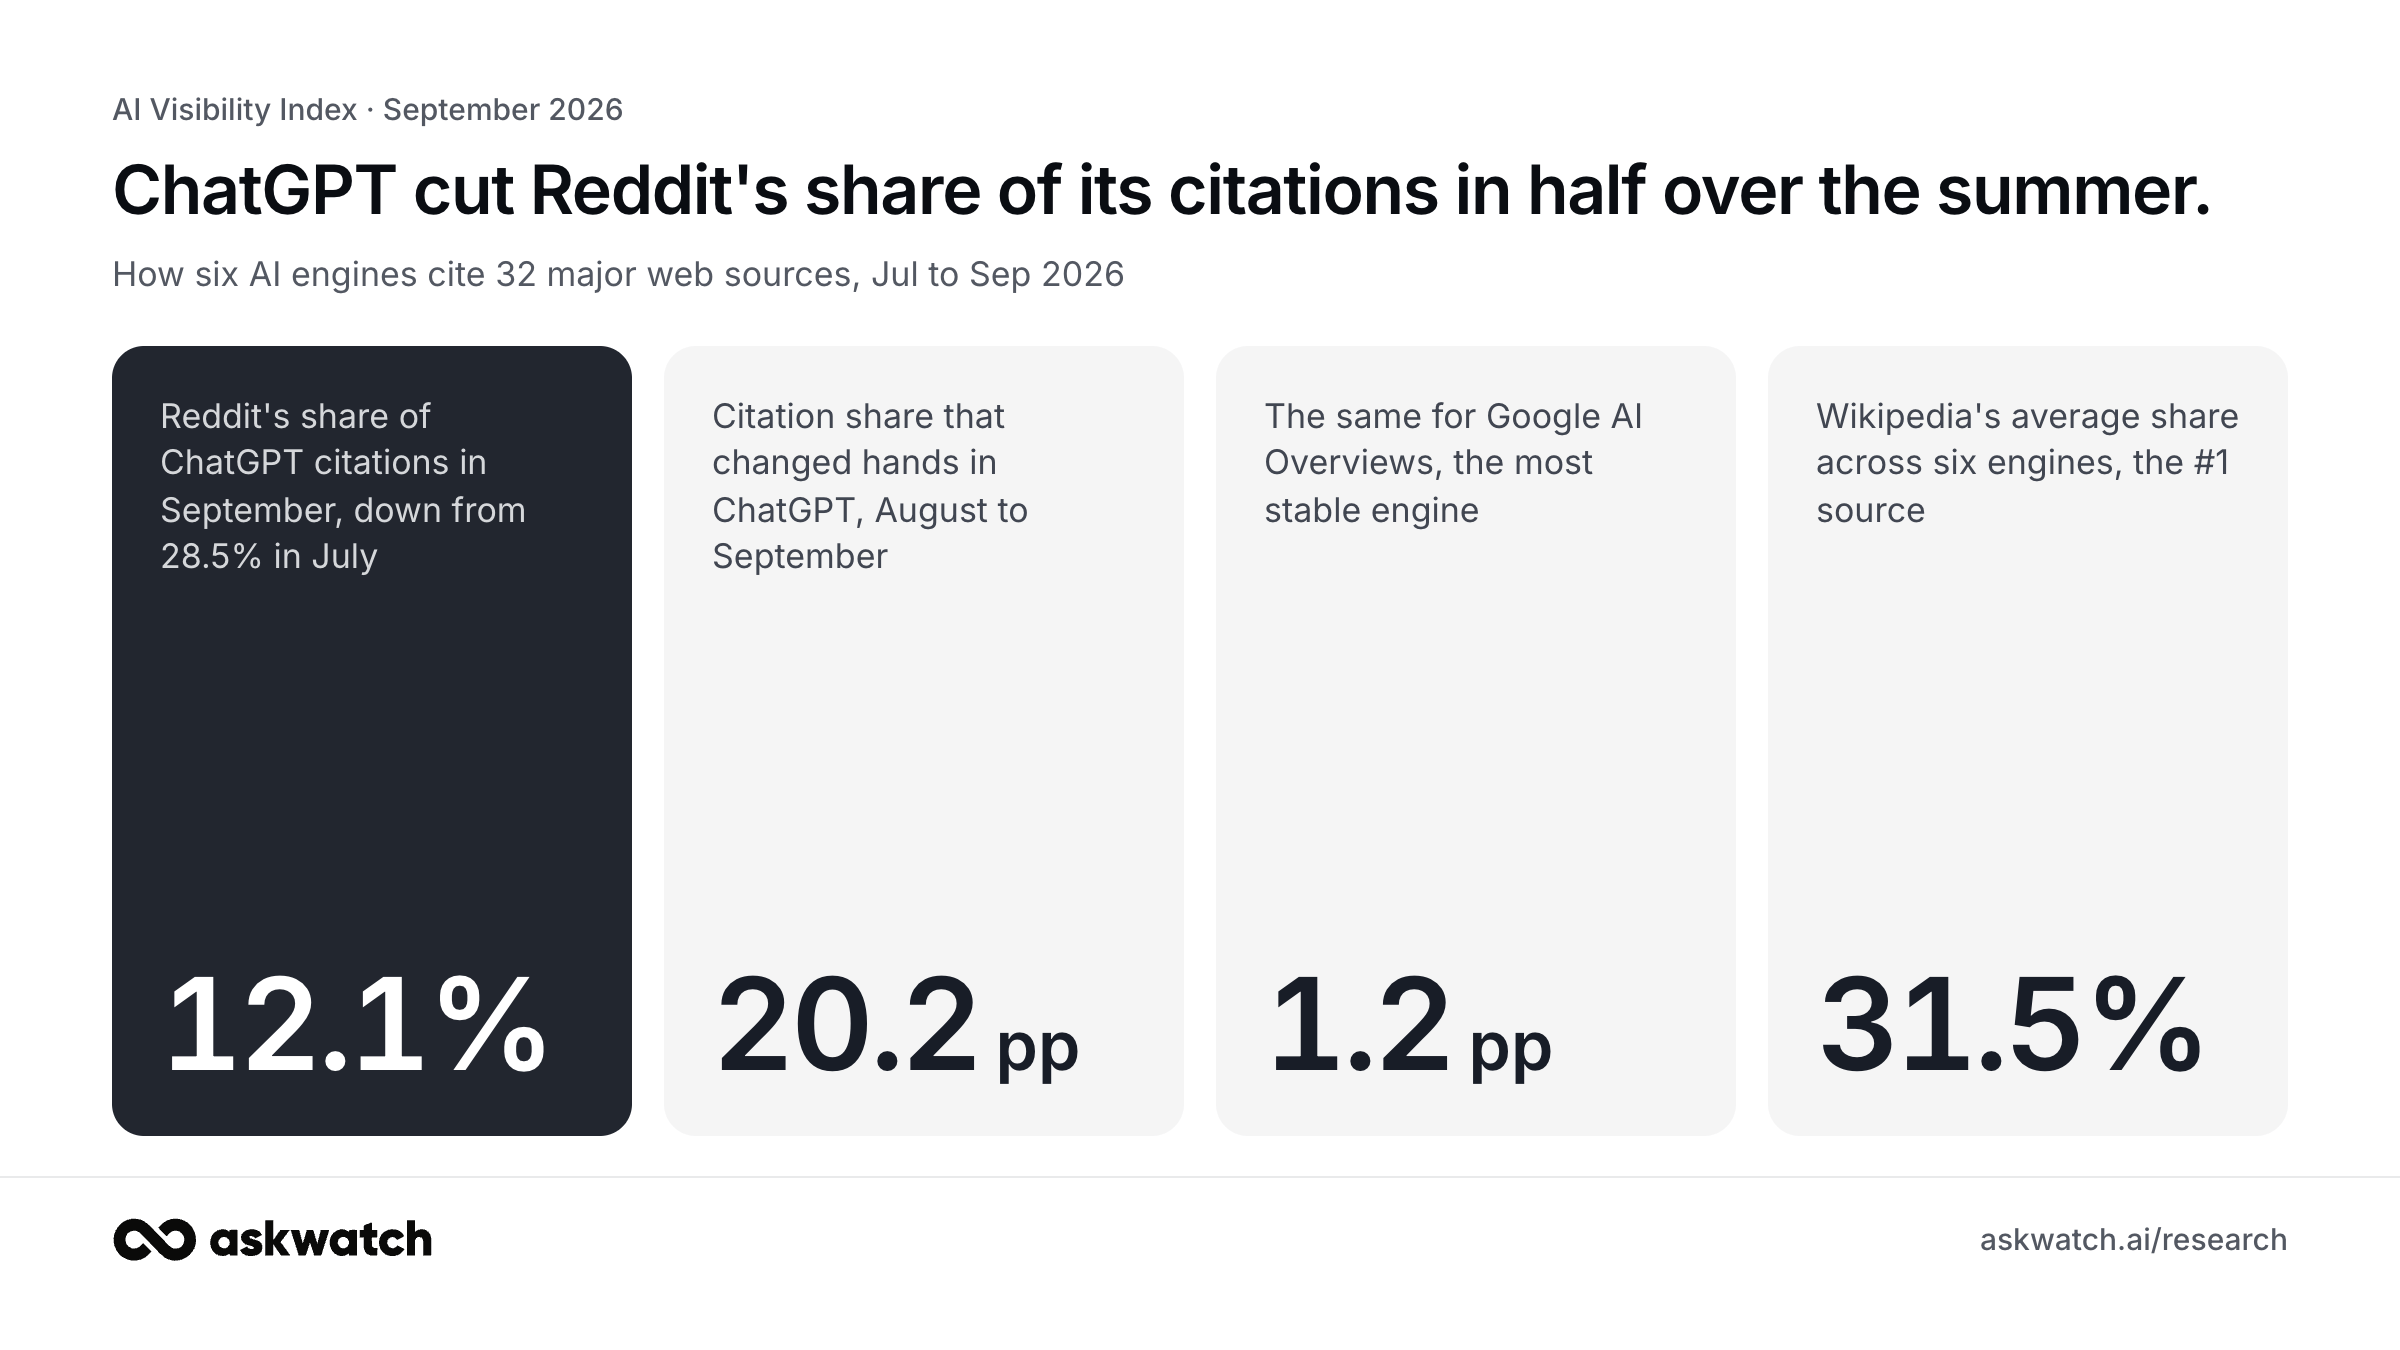
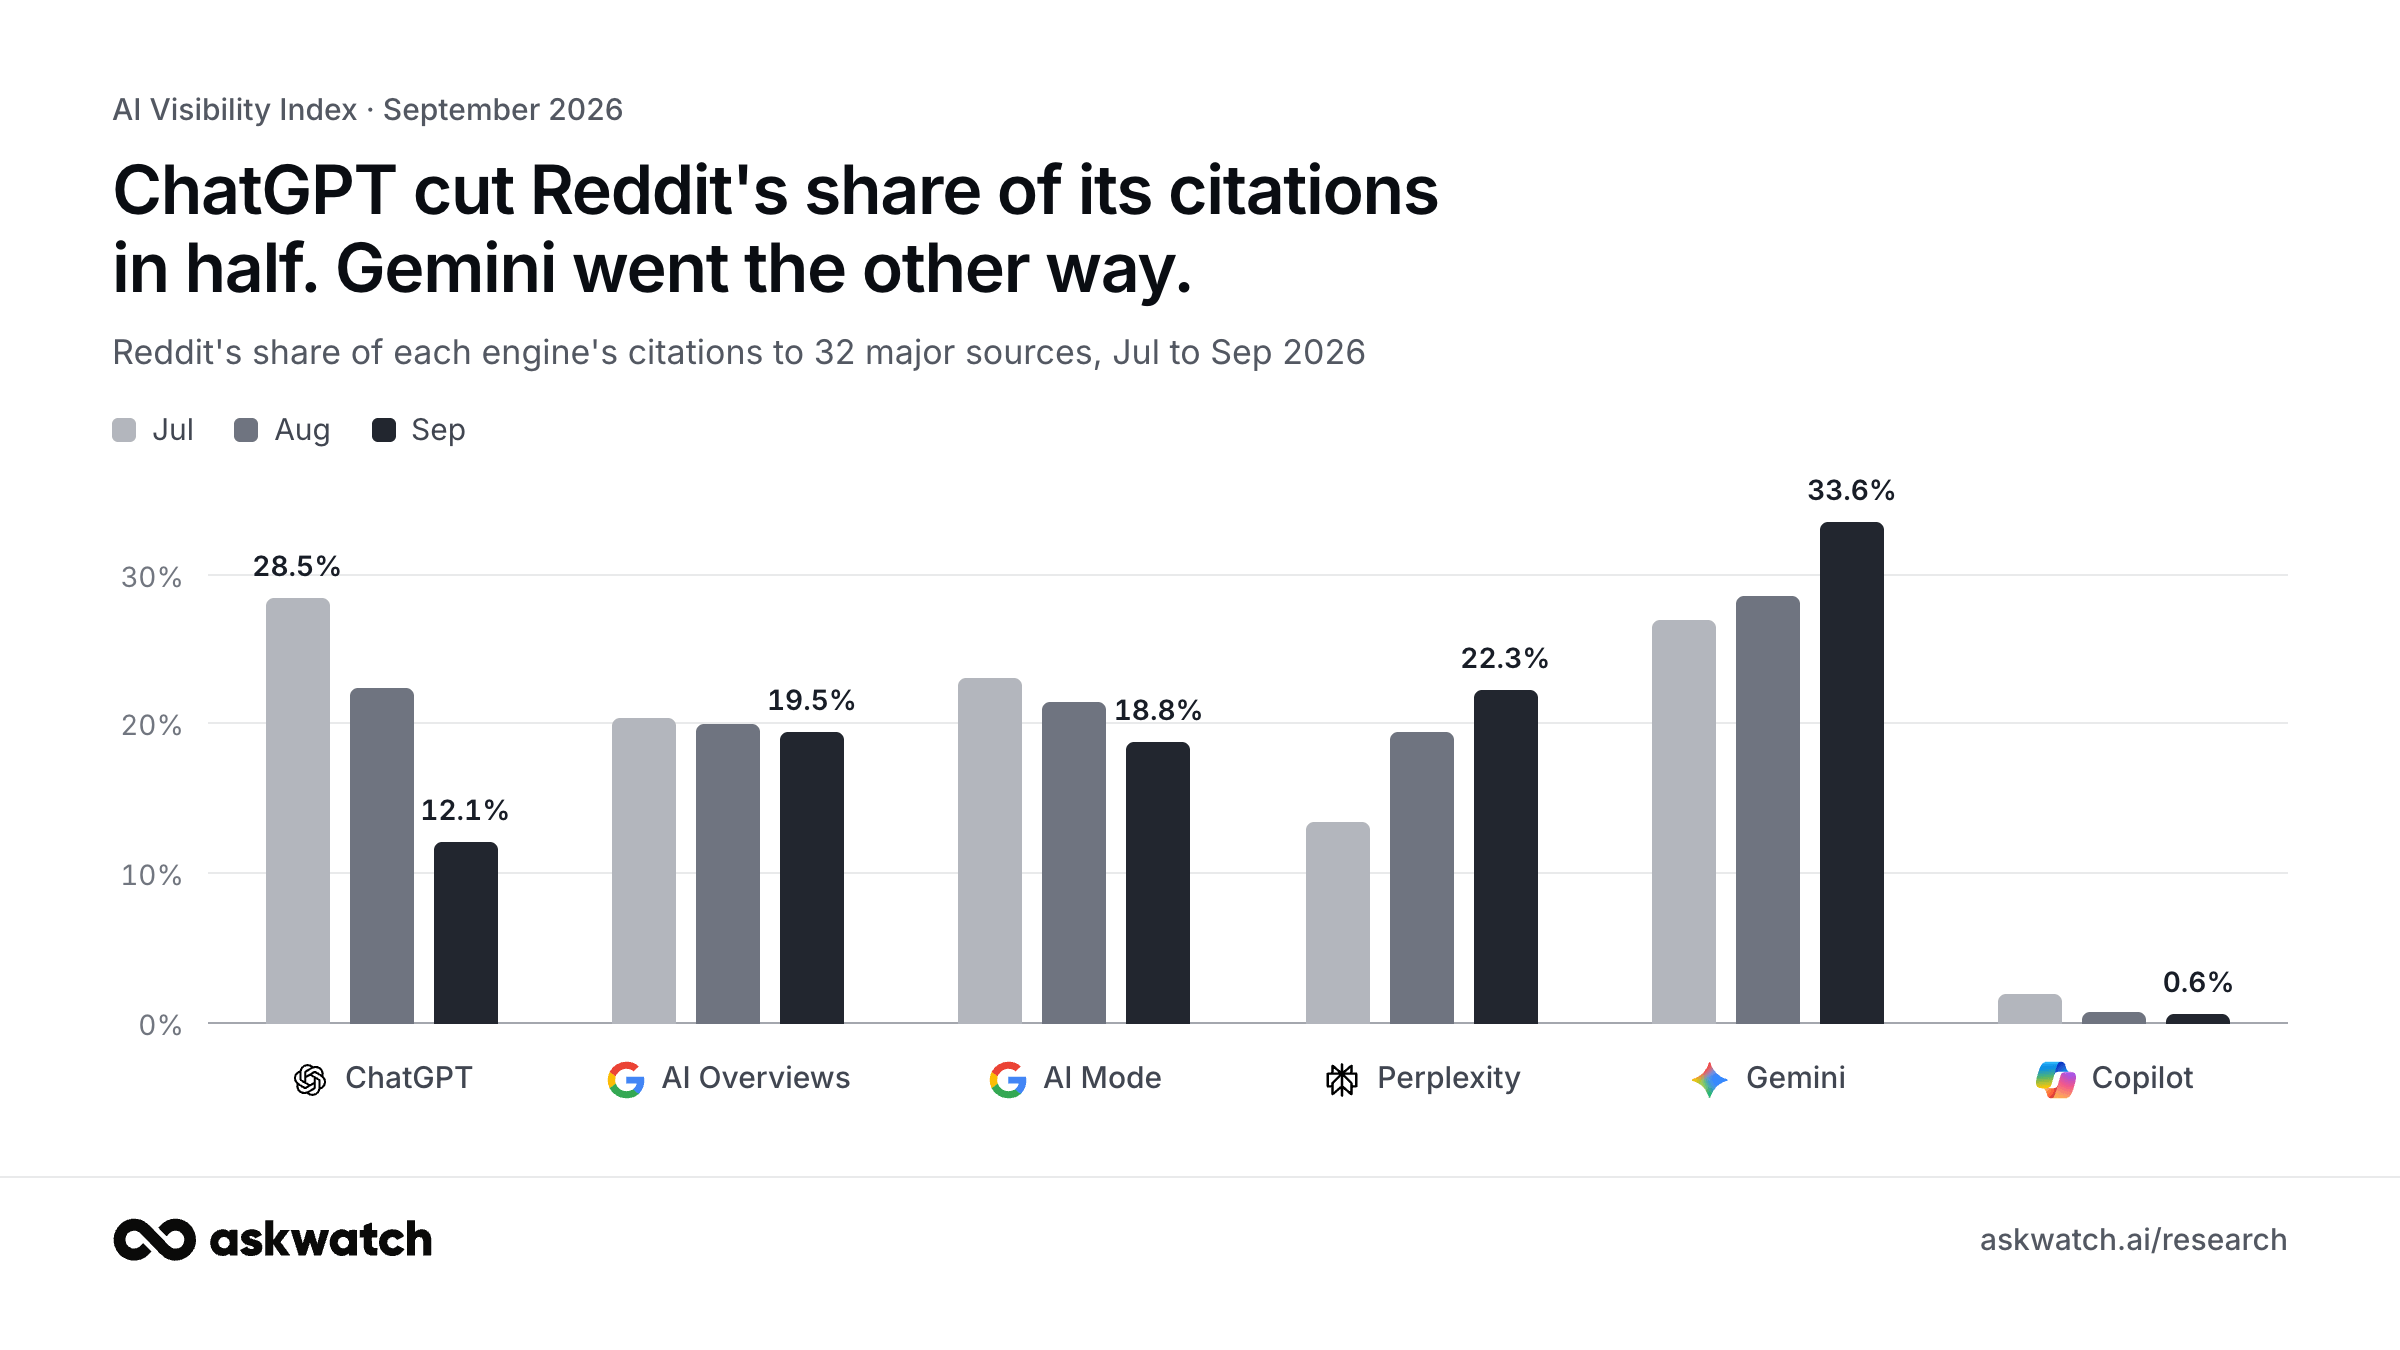
ChatGPT cut Reddit's share of its citations in half over the summer. Across a fixed panel of 32 major web sources, Reddit fell from 28.5% of ChatGPT's citations in July to 12.1% in September. Google's AI Overviews barely moved. Every engine now has a different favourite source, and the gap between them is widening.

Co-founder at AskWatch.ai
Published
What moved this month
- ChatGPT is moving away from forums and toward reference sites. User-generated sources (Reddit, YouTube, Quora, LinkedIn and the like) went from 39.6% of ChatGPT's panel citations in July to 21.7% in September. Reference sites (Wikipedia, NIH, Mayo Clinic, Healthline, Britannica) rose from 44.8% to 59.5%.
- Google AI Overviews is the most stable engine by far. Only 1.2 percentage points of citation share moved between panel domains from August to September. Three quarters of its citations still go to user-generated sources, with YouTube, TikTok and Reddit on top.
- Gemini is doing the opposite of ChatGPT. Reddit's share of Gemini citations rose from 27.0% to 33.6% over the same three months, and Gemini is the most concentrated engine: three domains take 85% of its citations.
- Perplexity is shifting toward commerce and news. Commerce sources (Amazon, TripAdvisor, Yelp, NerdWallet) doubled from 4.1% to 7.9% of Perplexity's citations; media sources rose from 2.3% to 4.2%.
- Engines agree on the top of the list and disagree on everything else. AI Overviews and AI Mode share an identical top 10; ChatGPT shares only 7 of its top 10 with any other engine. Gemini and Copilot overlap with the others on 6 of 10.
The Reddit divergence
Reddit's share of each engine's citations to the panel, three monthly snapshots.
Data behind this chart
| ChatGPT | AI Overviews | AI Mode | Perplexity | Gemini | Copilot | |
|---|---|---|---|---|---|---|
| Jul | 28.5% | 20.4% | 23.2% | 13.5% | 27.0% | 2.0% |
| Aug | 22.5% | 20.1% | 21.5% | 19.5% | 28.7% | 0.7% |
| Sep | 12.1% | 19.5% | 18.8% | 22.3% | 33.6% | 0.6% |
Restless engines, settled engines
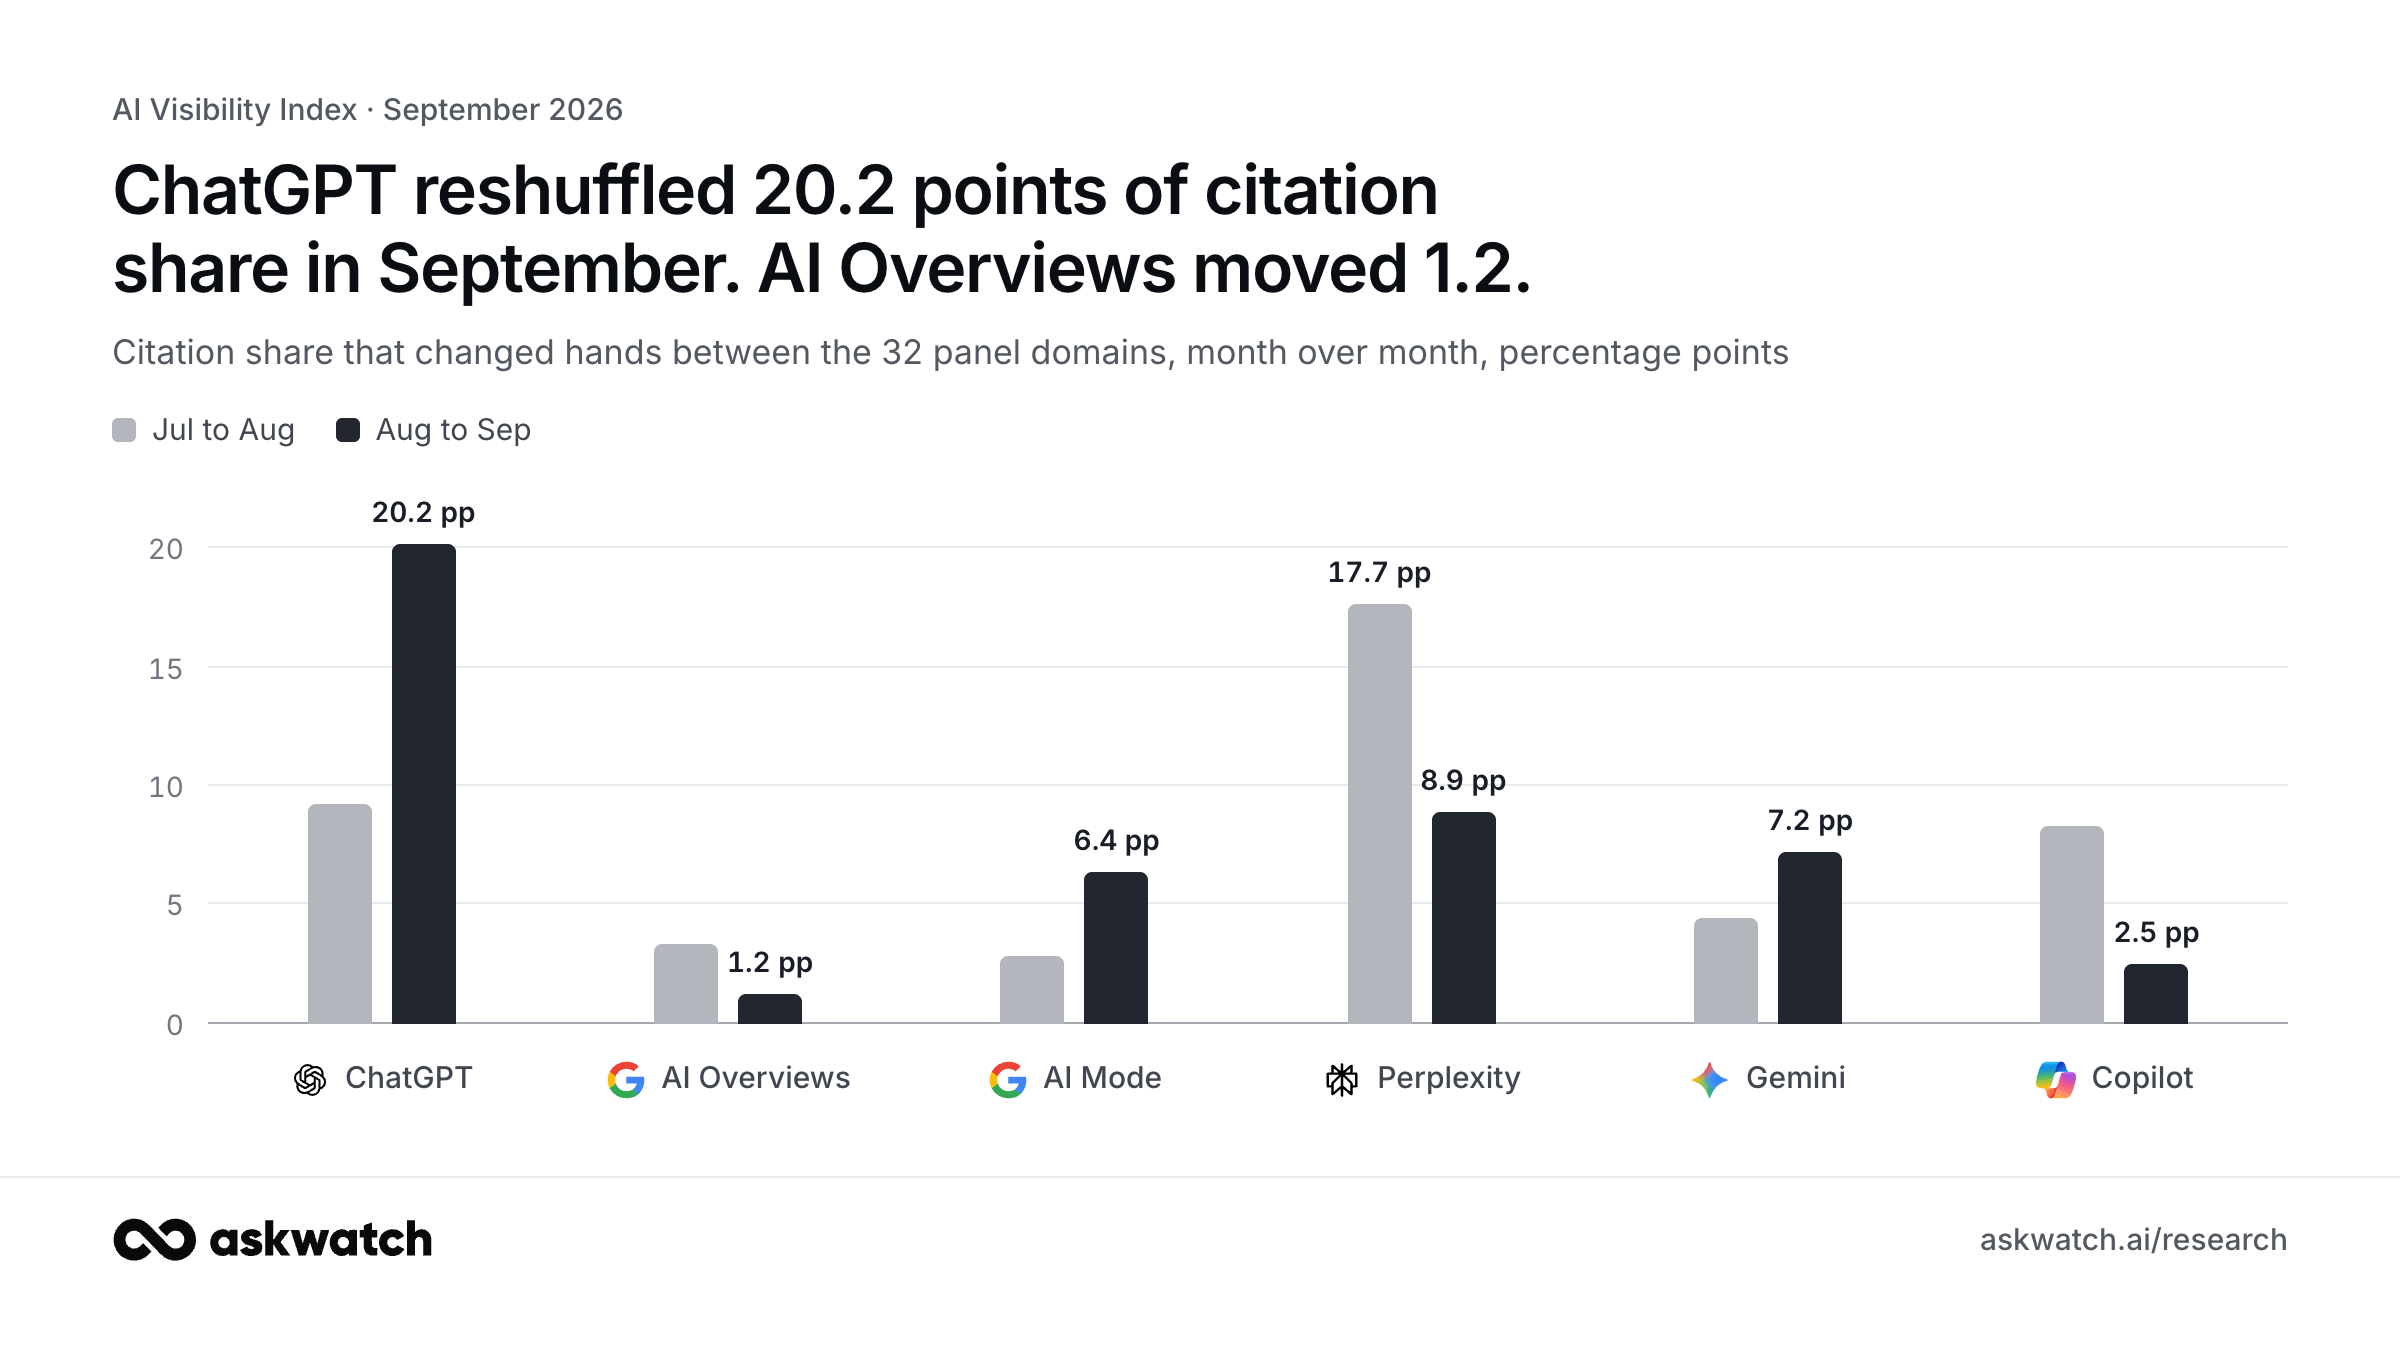
Citation turnover: how many percentage points of citation share moved between panel domains from one month to the next. Zero would mean every source kept exactly its share.
Data behind this chart
| ChatGPT | AI Overviews | AI Mode | Perplexity | Gemini | Copilot | |
|---|---|---|---|---|---|---|
| Jul to Aug | 9.2 pp | 3.3 pp | 2.8 pp | 17.7 pp | 4.4 pp | 8.3 pp |
| Aug to Sep | 20.2 pp | 1.2 pp | 6.4 pp | 8.9 pp | 7.2 pp | 2.5 pp |
Perplexity was the volatile one in August (17.7 pp) and calmed down in September (8.9 pp). ChatGPT went the other way: 9.2 pp in August, then 20.2 pp in September, the single largest monthly reshuffle in the panel. Copilot and AI Overviews stayed under 3 pp.
Six engines, six diets
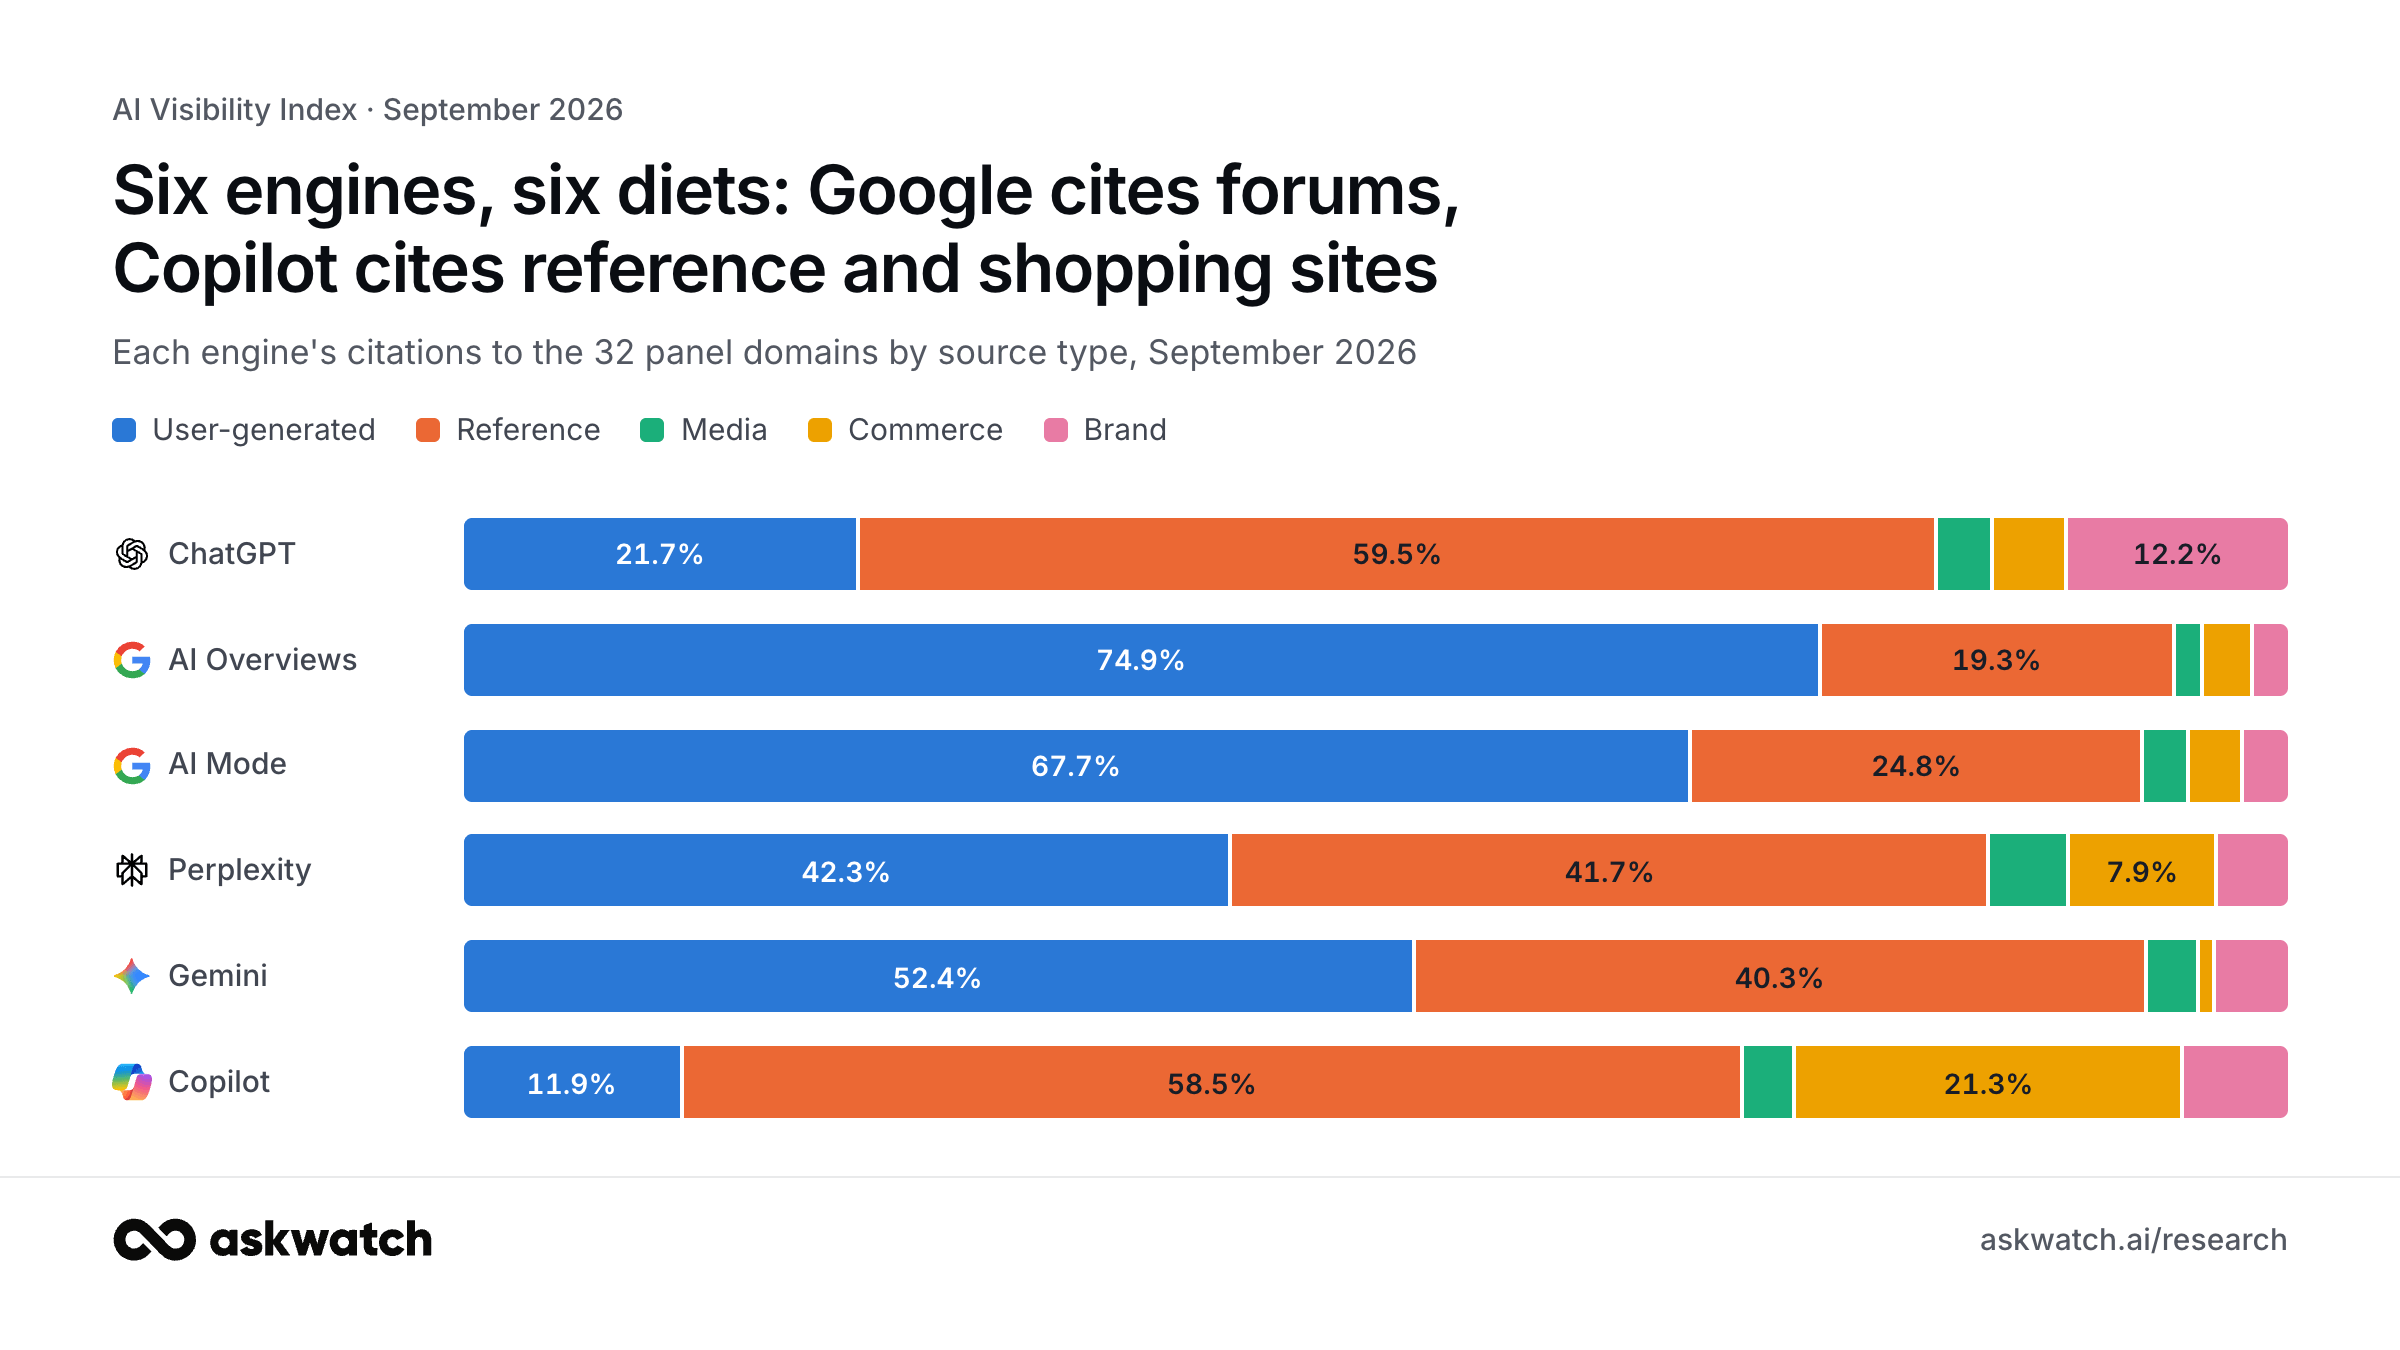
Panel domains grouped into five source types. Same panel, same month, six very different answers.
Data behind this chart
| User-generated | Reference | Media | Commerce | Brand | |
|---|---|---|---|---|---|
| ChatGPT | 21.7% | 59.5% | 2.8% | 3.9% | 12.2% |
| AI Overviews | 74.9% | 19.3% | 1.4% | 2.5% | 1.9% |
| AI Mode | 67.7% | 24.8% | 2.3% | 2.8% | 2.4% |
| Perplexity | 42.3% | 41.7% | 4.2% | 7.9% | 3.9% |
| Gemini | 52.4% | 40.3% | 2.7% | 0.6% | 4.0% |
| Copilot | 11.9% | 58.5% | 2.6% | 21.3% | 5.7% |
Source types: user-generated = Reddit, YouTube, Quora, Stack Overflow, LinkedIn, Medium, GitHub, TikTok · reference = Wikipedia, Britannica, Investopedia, Healthline, Mayo Clinic, WebMD, NIH · media = NYT, Forbes, BBC, TechCrunch, CNET · commerce = Amazon, G2, TripAdvisor, NerdWallet, Yelp, Capterra · brand = HubSpot, Shopify, Semrush, Zapier, Apple, Microsoft.
ChatGPT's summer diet change
The user-generated block shrank from 40% to 22% while the reference block grew from 45% to 60%. Brand sites grew from 8% to 12%.
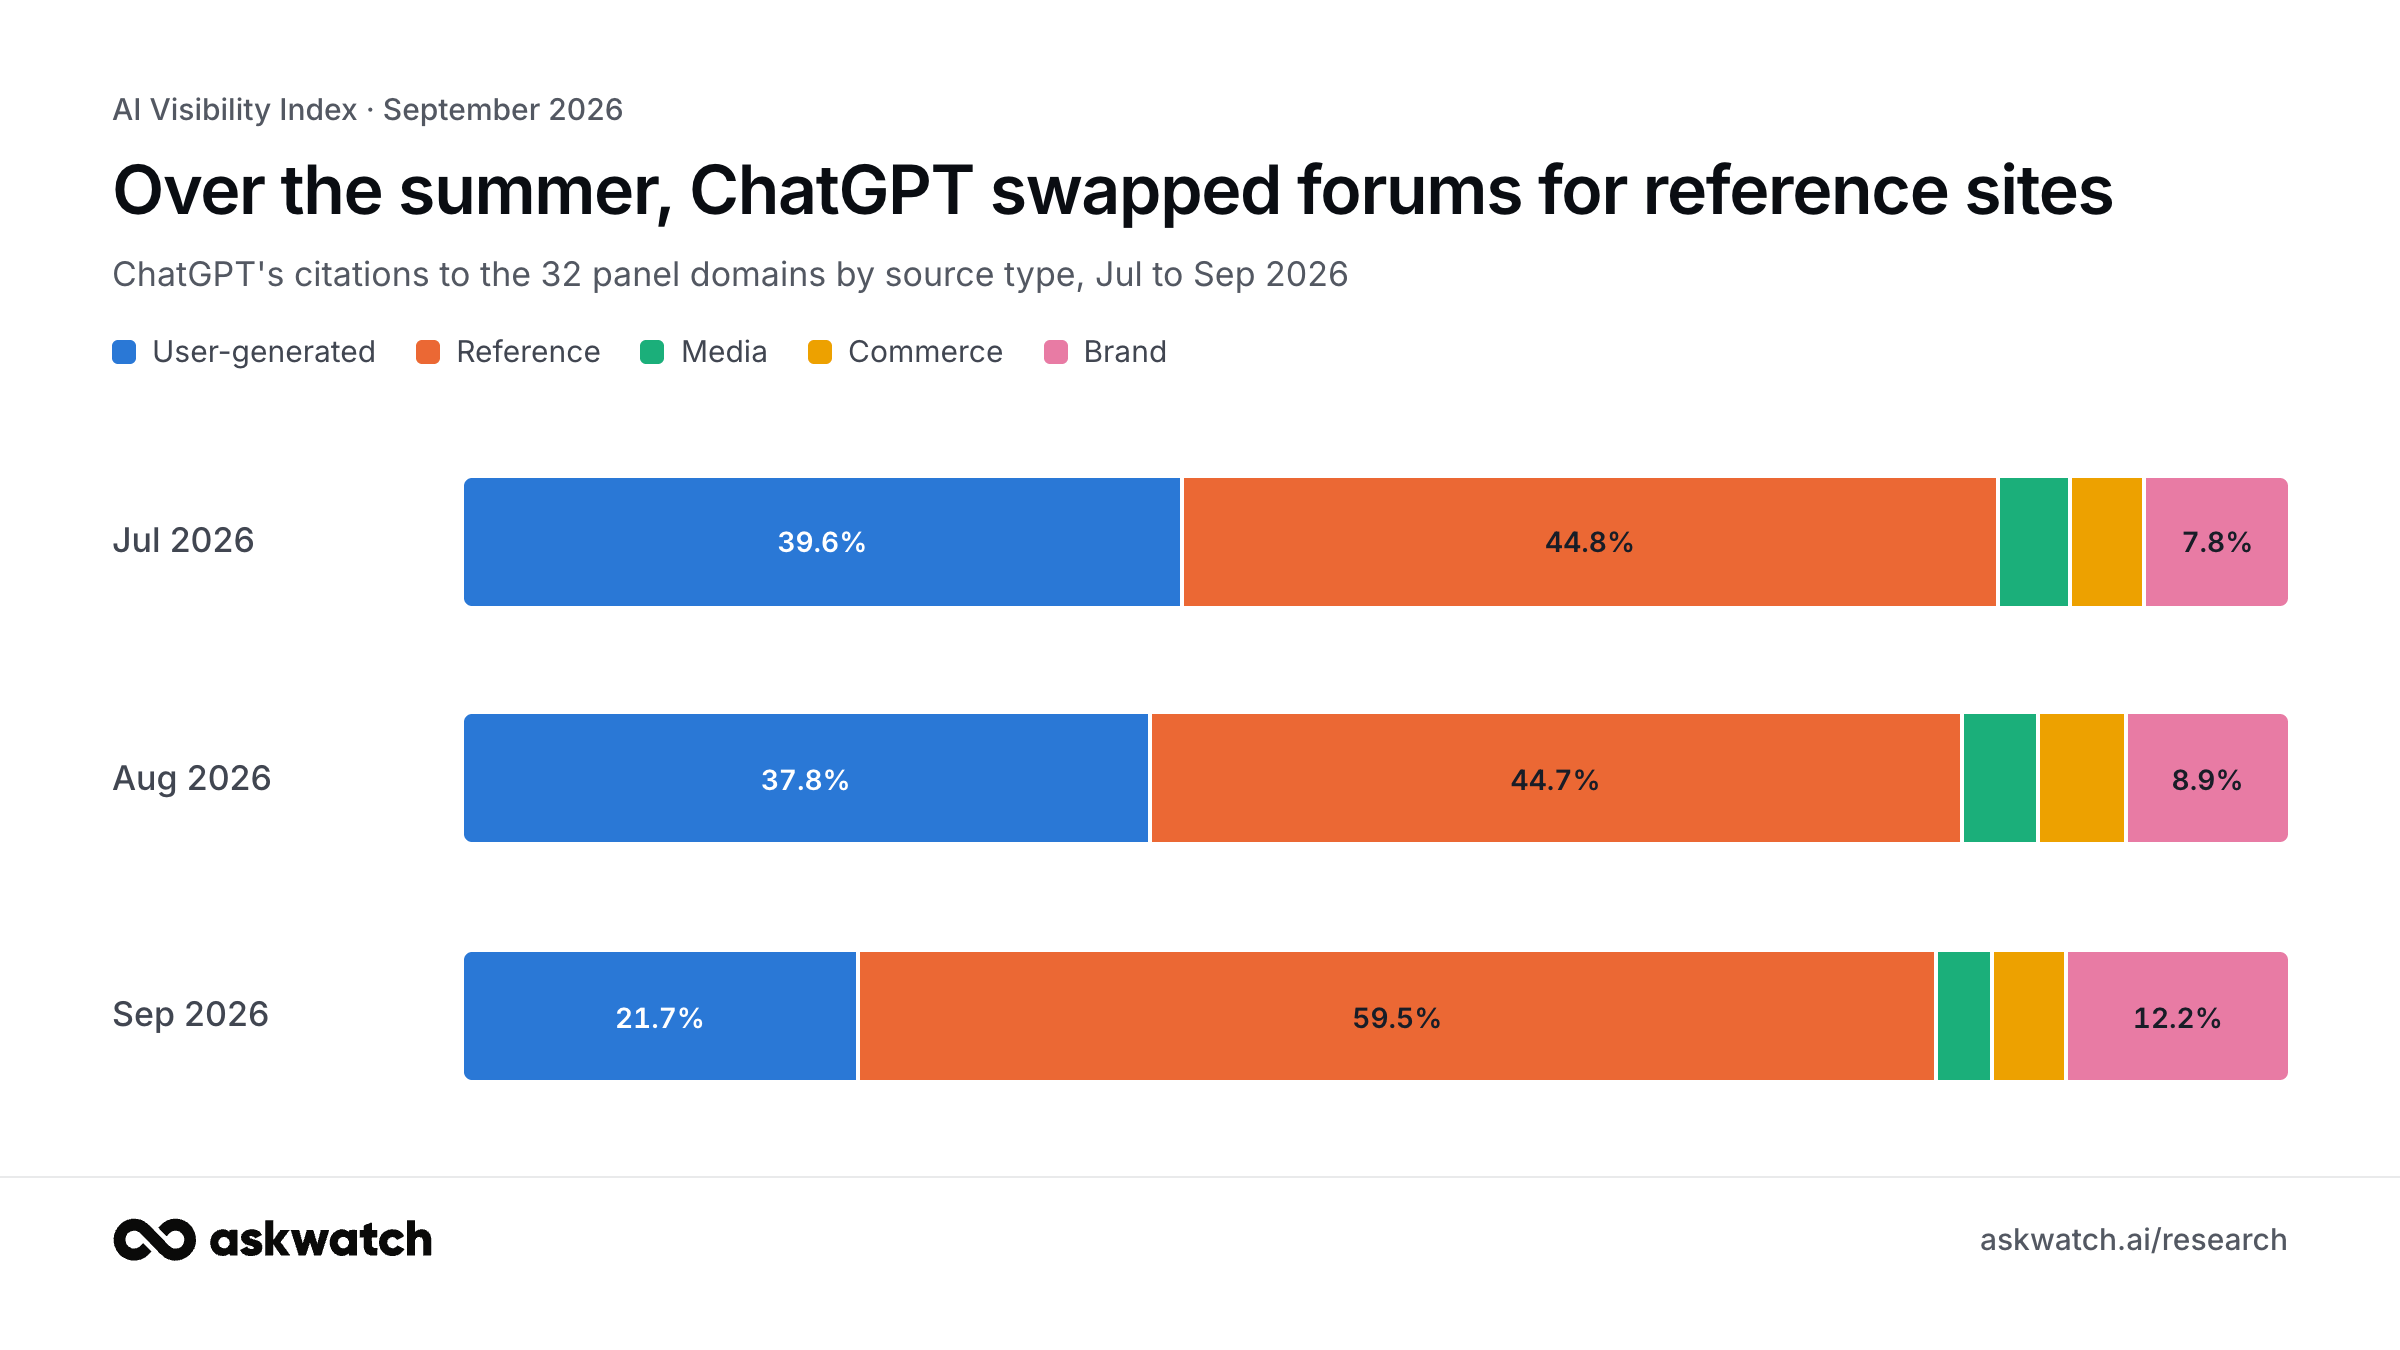
Data behind this chart
| User-generated | Reference | Media | Commerce | Brand | |
|---|---|---|---|---|---|
| Jul | 39.6% | 44.8% | 3.8% | 3.9% | 7.8% |
| Aug | 37.8% | 44.7% | 4.0% | 4.6% | 8.9% |
| Sep | 21.7% | 59.5% | 2.8% | 3.9% | 12.2% |
Copilot is the outlier at the other end: 58.5% reference and 21.3% commerce (mostly Amazon), with user-generated sources under 12%. If Copilot answers questions about your product, Amazon listings and Wikipedia matter more than Reddit threads.
The citation leaderboard
AI Visibility Score is a domain's average share of citations across all six engines. Change is September against August; up and down count the engines where the domain's share moved by more than 5%.
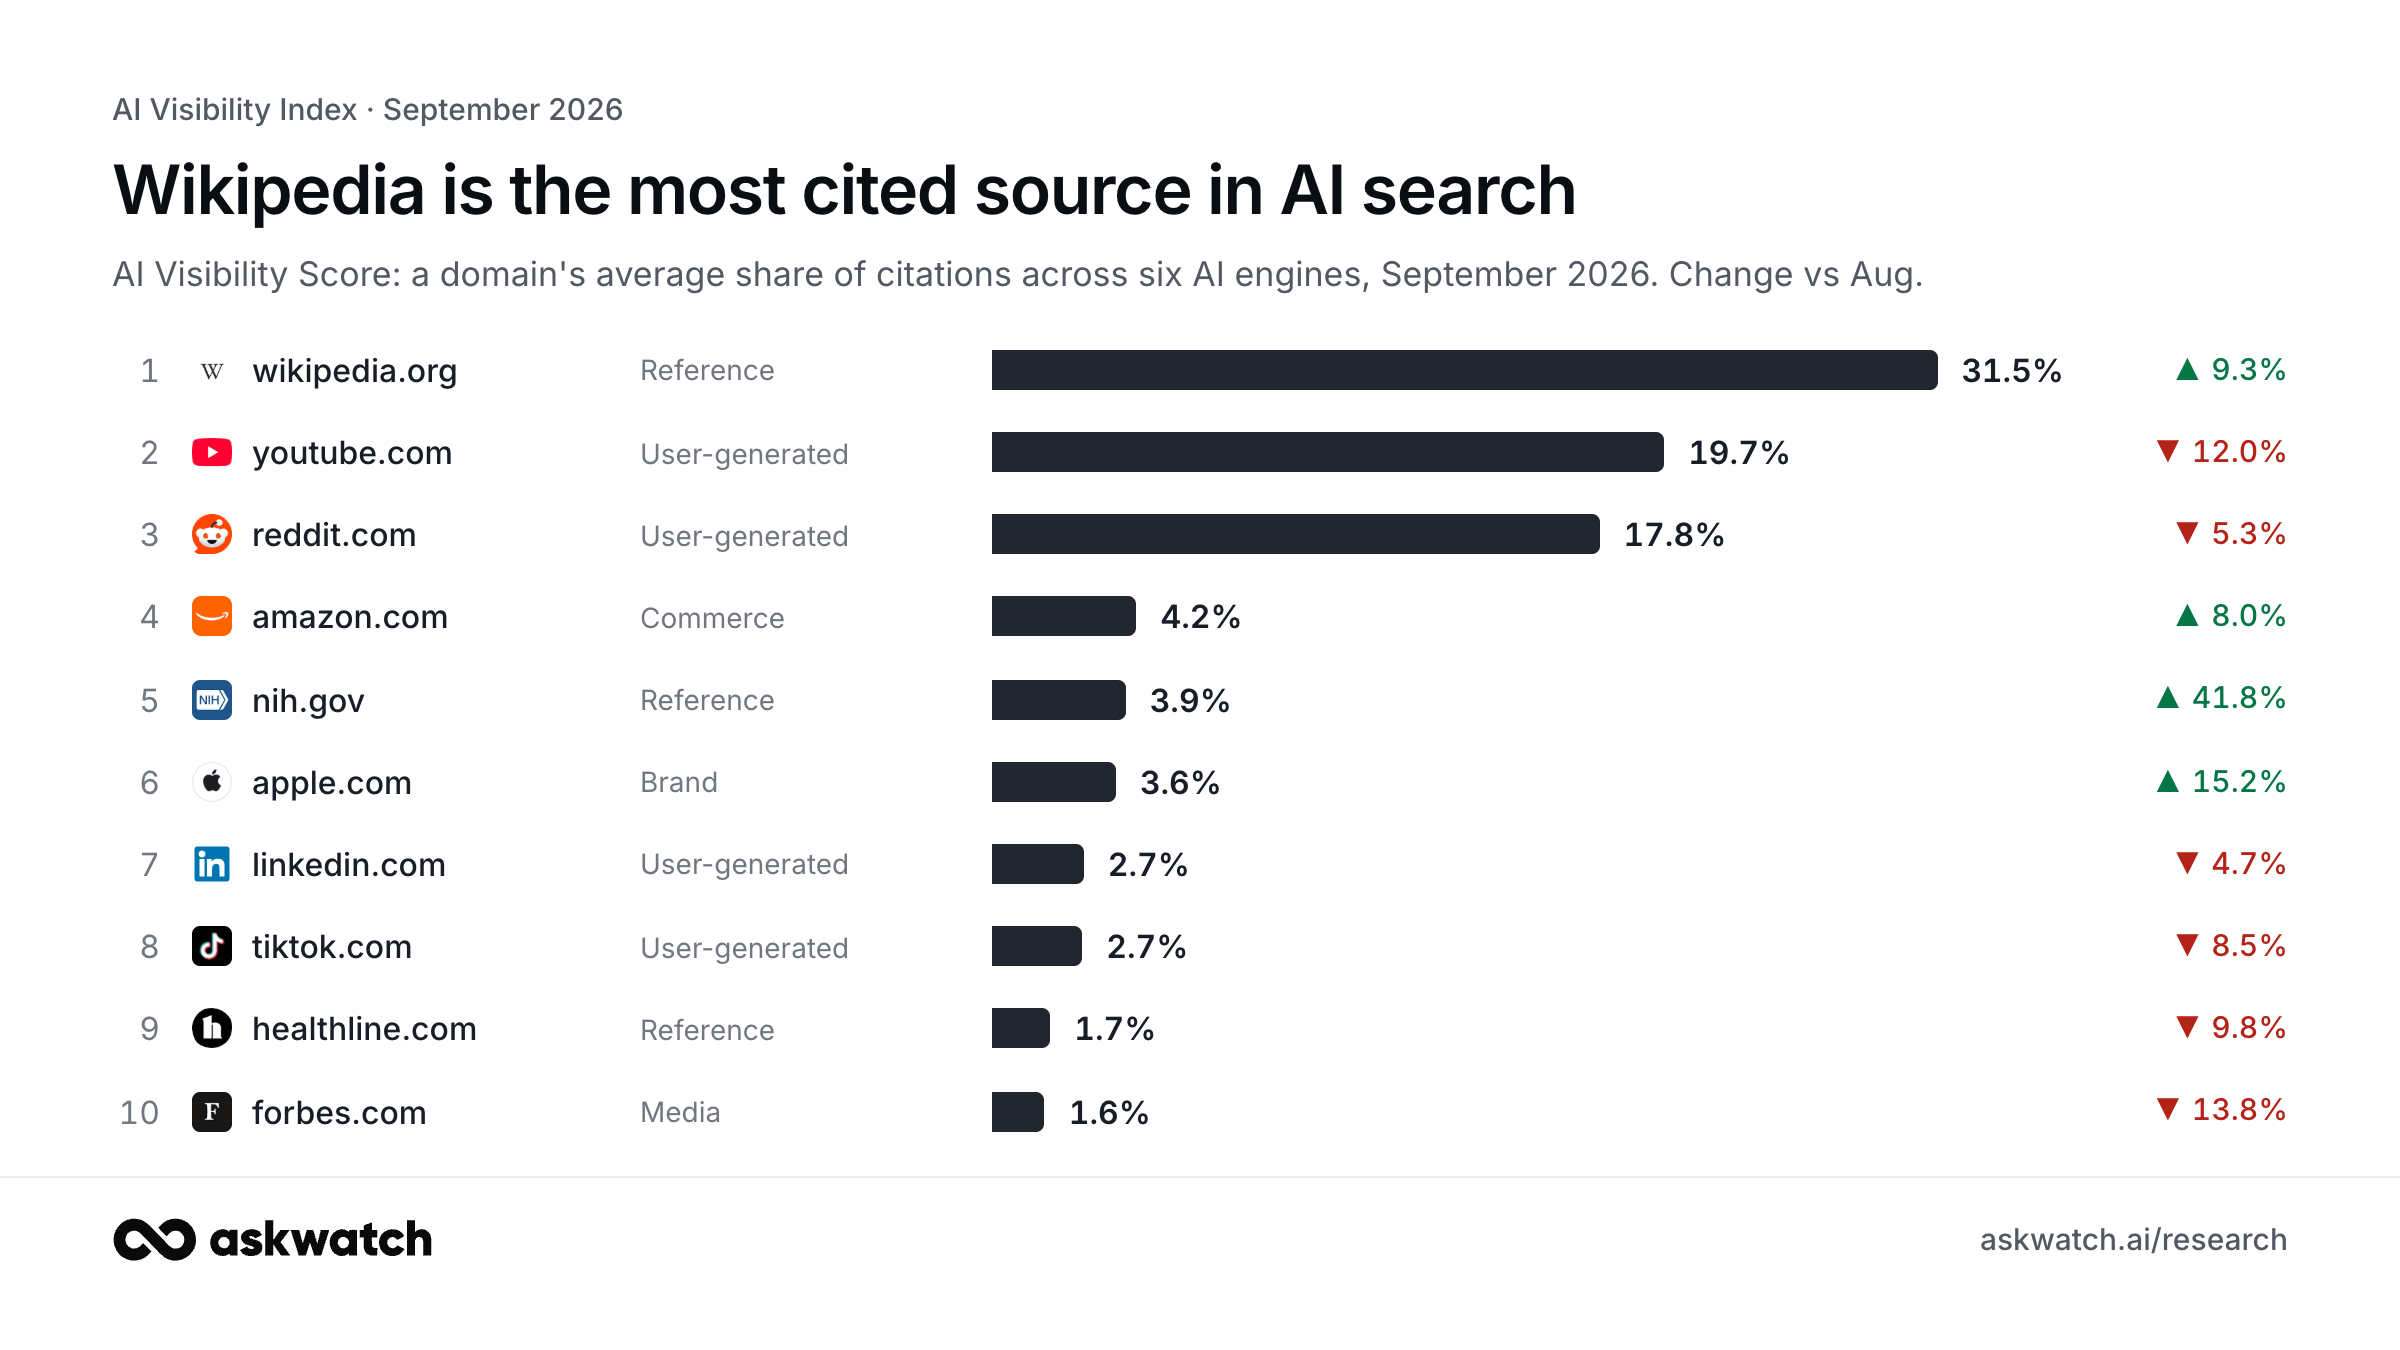
| Domain | Type | Score Sep | Aug | Jul | Δ pp | Δ % | Up / down |
|---|---|---|---|---|---|---|---|
| 1. wikipedia.org | Reference | 31.5 | 28.8 | 28.5 | +2.7 | +9.3% | 4 / 0 |
| 2. youtube.com | User-generated | 19.7 | 22.4 | 24.6 | −2.7 | −12.0% | 1 / 3 |
| 3. reddit.com | User-generated | 17.8 | 18.8 | 19.1 | −1.0 | −5.3% | 2 / 3 |
| 4. amazon.com | Commerce | 4.2 | 3.9 | 2.6 | +0.3 | +8.0% | 2 / 2 |
| 5. nih.gov | Reference | 3.9 | 2.8 | 2.2 | +1.2 | +41.8% | 4 / 2 |
| 6. apple.com | Brand | 3.6 | 3.2 | 3.0 | +0.5 | +15.2% | 3 / 0 |
| 7. linkedin.com | User-generated | 2.7 | 2.8 | 2.6 | −0.1 | −4.7% | 2 / 3 |
| 8. tiktok.com | User-generated | 2.7 | 2.9 | 3.1 | −0.2 | −8.5% | 1 / 2 |
| 9. healthline.com | Reference | 1.7 | 1.9 | 2.1 | −0.2 | −9.8% | 1 / 2 |
| 10. forbes.com | Media | 1.6 | 1.8 | 1.8 | −0.3 | −13.8% | 1 / 5 |
| 11. quora.com | User-generated | 1.4 | 1.6 | 1.8 | −0.3 | −16.0% | 3 / 2 |
| 12. mayoclinic.org | Reference | 1.3 | 1.3 | 1.4 | +0.0 | +2.2% | 2 / 1 |
| 13. tripadvisor.com | Commerce | 1.1 | 1.2 | 0.9 | −0.1 | −6.0% | 0 / 3 |
| 14. britannica.com | Reference | 1.0 | 1.0 | 1.0 | +0.1 | +5.5% | 2 / 1 |
| 15. webmd.com | Reference | 1.0 | 1.1 | 1.1 | −0.0 | −3.6% | 1 / 1 |
| 16. microsoft.com | Brand | 0.9 | 0.8 | 0.8 | +0.2 | +23.1% | 2 / 1 |
| 17. medium.com | User-generated | 0.7 | 0.8 | 0.8 | −0.1 | −10.9% | 0 / 5 |
| 18. nerdwallet.com | Commerce | 0.5 | 0.5 | 0.4 | +0.0 | +1.9% | 2 / 2 |
| 19. cnet.com | Media | 0.4 | 0.5 | 0.5 | −0.0 | −8.1% | 1 / 2 |
| 20. nytimes.com | Media | 0.4 | 0.3 | 0.3 | +0.1 | +15.7% | 3 / 1 |
Gained the most share
Domains with a score of 0.5 or more
- nih.gov+41.8%
- microsoft.com+23.1%
- apple.com+15.2%
- wikipedia.org+9.3%
- amazon.com+8.0%
- britannica.com+5.5%
Lost the most share
Domains with a score of 0.5 or more
- quora.com−16.0%
- forbes.com−13.8%
- youtube.com−12.0%
- medium.com−10.9%
- healthline.com−9.8%
- tiktok.com−8.5%
Where the engines part ways
The number of domains two engines share in their top-10 lists, September 2026.
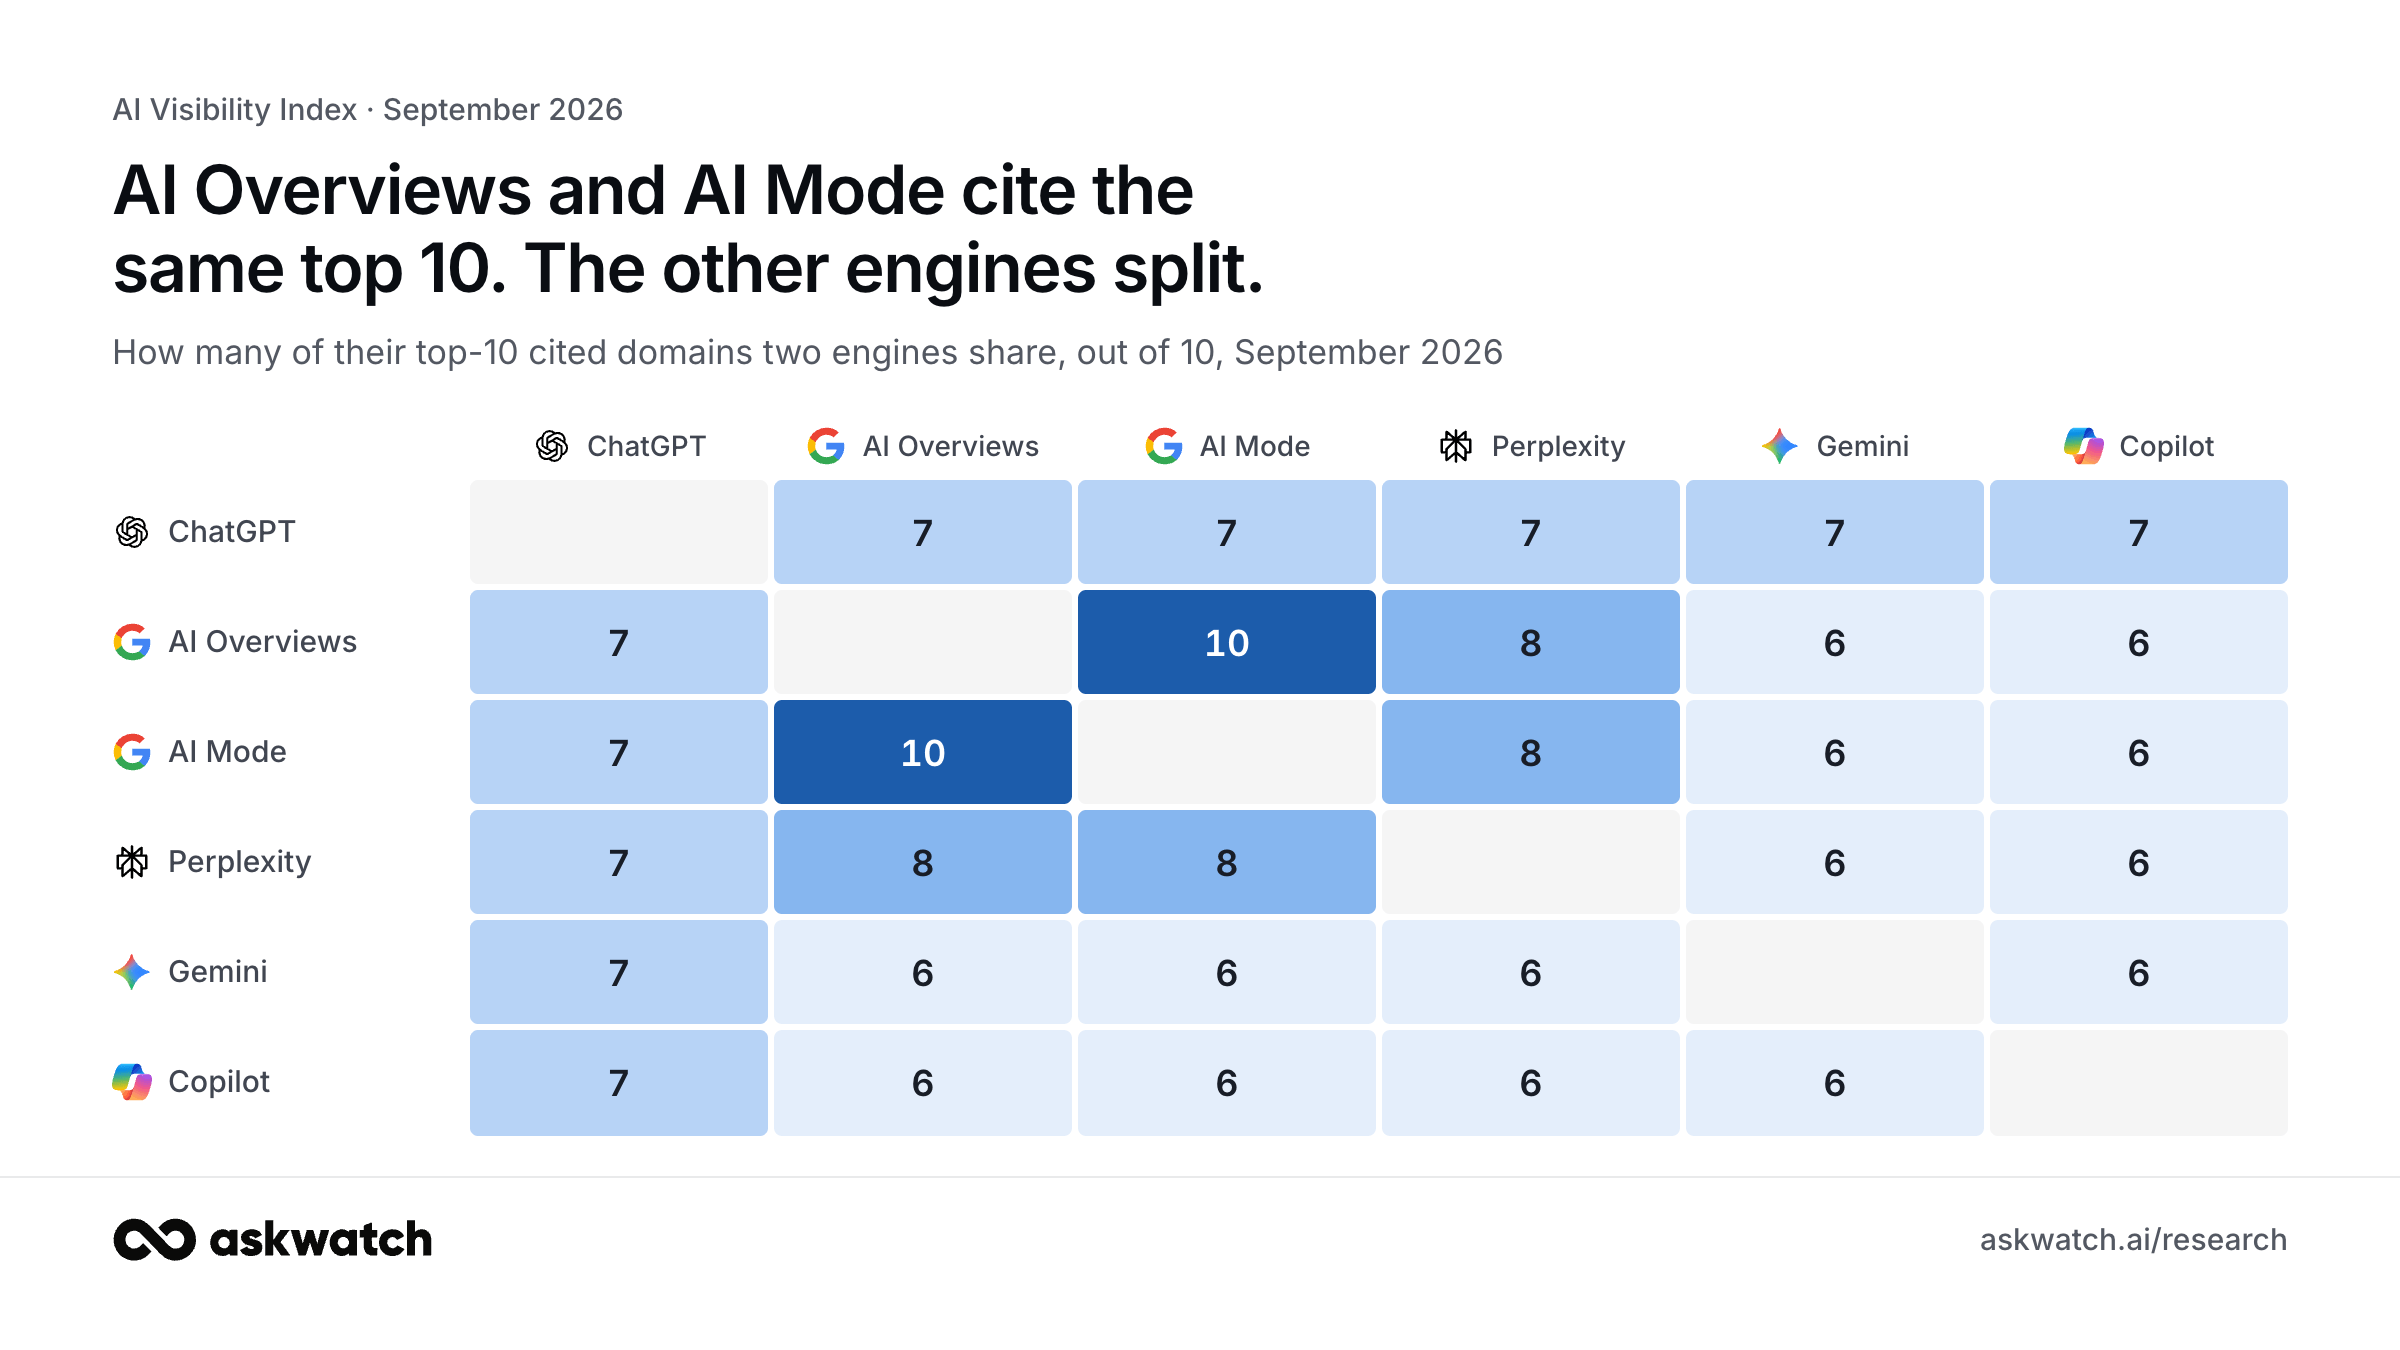
Data behind this chart
| ChatGPT | AI Overviews | AI Mode | Perplexity | Gemini | Copilot | |
|---|---|---|---|---|---|---|
| ChatGPT | — | 7 | 7 | 7 | 7 | 7 |
| AI Overviews | 7 | — | 10 | 8 | 6 | 6 |
| AI Mode | 7 | 10 | — | 8 | 6 | 6 |
| Perplexity | 7 | 8 | 8 | — | 6 | 6 |
| Gemini | 7 | 6 | 6 | 6 | — | 6 |
| Copilot | 7 | 6 | 6 | 6 | 6 | — |
Three sites, most of the answer
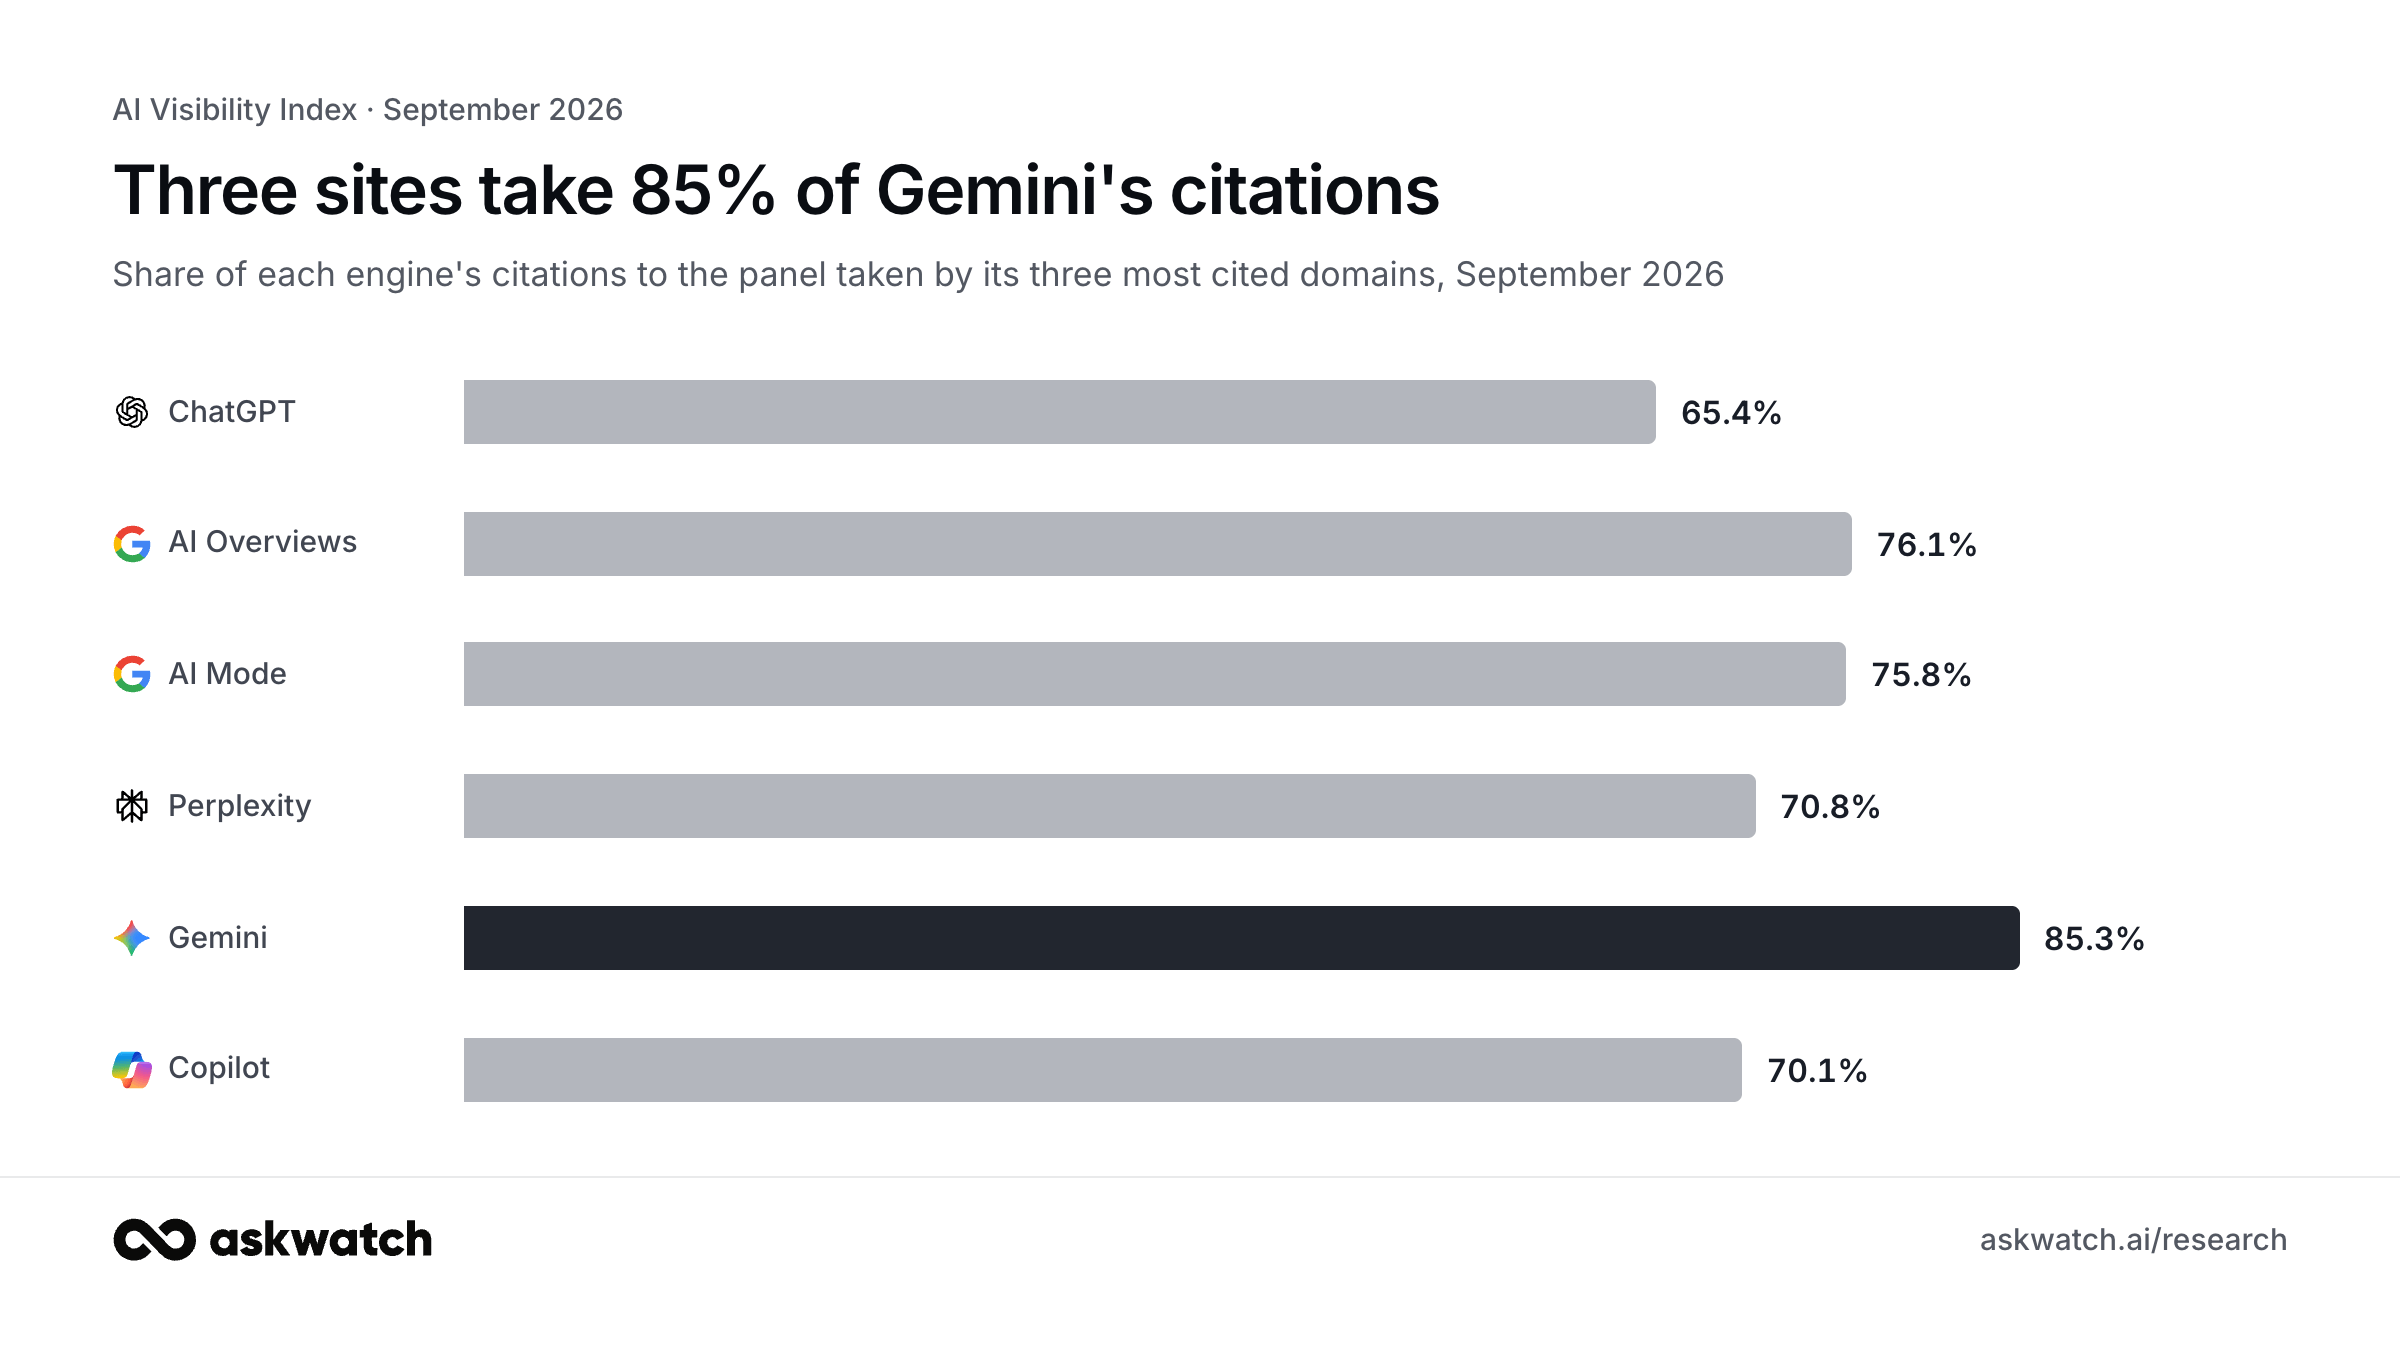
Data behind this chart
| ChatGPT | AI Overviews | AI Mode | Perplexity | Gemini | Copilot | |
|---|---|---|---|---|---|---|
| Top three domains | 65.4% | 76.1% | 75.8% | 70.8% | 85.3% | 70.1% |
Gemini is the most concentrated engine; ChatGPT the least. For a brand, this means the same three sites decide most of what Gemini says, while ChatGPT spreads its attention wider.
Zooming in: five markets, five maps
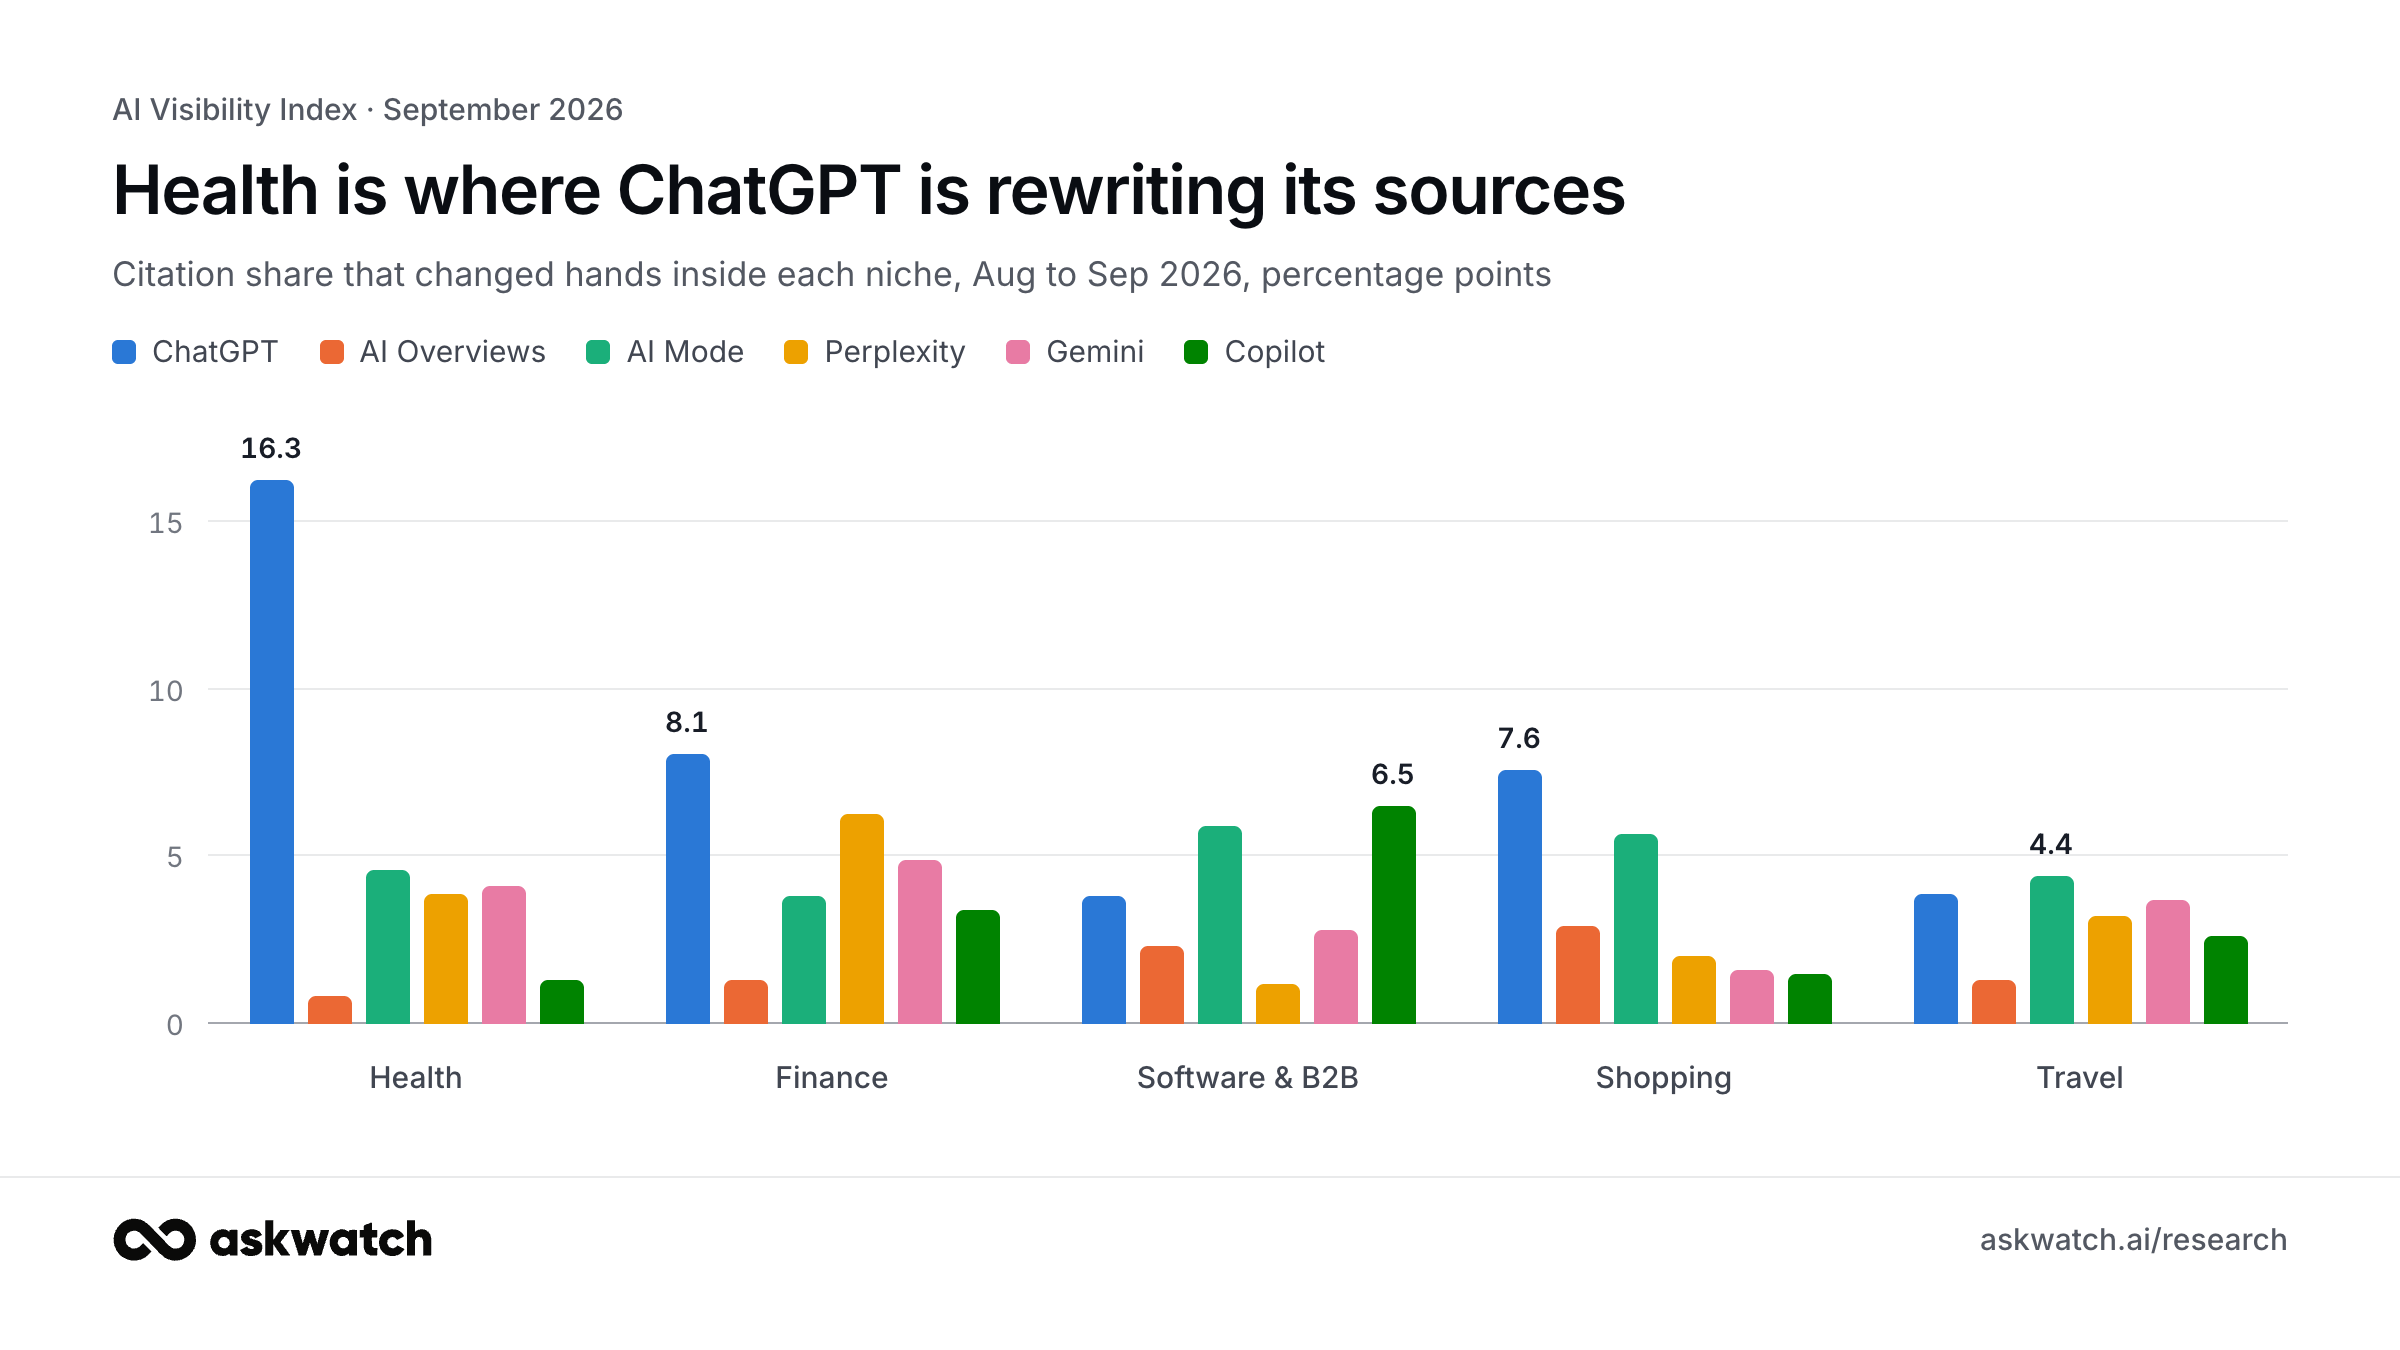
Twenty more domains look inside five markets. Each niche is a closed panel of its own, so shares add up to 100% within it. Score is the average share across six engines in September; leads is the number of engines where the domain is the niche's #1 source.
Data behind this chart
| ChatGPT | AI Overviews | AI Mode | Perplexity | Gemini | Copilot | |
|---|---|---|---|---|---|---|
| Health | 16.3 | 0.8 | 4.6 | 3.9 | 4.1 | 1.3 |
| Finance | 8.1 | 1.3 | 3.8 | 6.3 | 4.9 | 3.4 |
| Software & B2B | 3.8 | 2.3 | 5.9 | 1.2 | 2.8 | 6.5 |
| Shopping | 7.6 | 2.9 | 5.7 | 2.0 | 1.6 | 1.5 |
| Travel | 3.9 | 1.3 | 4.4 | 3.2 | 3.7 | 2.6 |
Health is where ChatGPT is rewriting its sources. Inside the seven health sites, 16.3 pp of ChatGPT's citation share moved in one month, against 0.8 pp in AI Overviews. NIH gained 3.5 pp of the niche and now leads in ChatGPT and AI Mode; Healthline still leads in AI Overviews, Perplexity and Gemini.
Finance has one owner. Forbes takes 52.7% of niche citations and is the #1 finance source in all six engines. NerdWallet is a distant second at 15.6%.
In software, review media beat review marketplaces. TechRadar and PCMag together hold 70% of the niche; G2, Capterra and Software Advice combined hold 18.5%. Product Hunt is cited almost never (0.4%).
Trustpilot is a top-two shopping source. At 23.7% of niche citations Trustpilot sits just behind Amazon (26.8%) and leads in ChatGPT and Gemini. Walmart (18.1%) is cited more than eBay and Best Buy combined.
Travel is a two-horse race. TripAdvisor (36.6%) and Booking.com (34.6%) split the niche; TripAdvisor leads in four engines, Booking.com in ChatGPT and Gemini.
Health
| Domain | Score | Δ pp | Leads |
|---|---|---|---|
| nih.gov | 26.8% | +3.5 | 2 |
| healthline.com | 19.5% | −1.8 | 3 |
| clevelandclinic.org | 13.9% | −0.2 | 1 |
| mayoclinic.org | 12.1% | −0.5 | |
| webmd.com | 11.7% | −0.7 | |
| drugs.com | 9.2% | +0.2 | |
| medicalnewstoday.com | 6.9% | −0.7 |
Finance
| Domain | Score | Δ pp | Leads |
|---|---|---|---|
| forbes.com | 52.7% | −2.0 | 6 |
| nerdwallet.com | 15.6% | +1.0 | |
| investopedia.com | 8.9% | +0.2 | |
| bankrate.com | 7.1% | +0.2 | |
| cnbc.com | 7.0% | +0.6 | |
| fool.com | 6.8% | 0.0 | |
| bloomberg.com | 2.0% | 0.0 |
Software & B2B
| Domain | Score | Δ pp | Leads |
|---|---|---|---|
| techradar.com | 38.5% | −1.4 | 2 |
| pcmag.com | 31.9% | −0.7 | 4 |
| g2.com | 10.5% | +0.5 | |
| capterra.com | 5.4% | +0.5 | |
| zapier.com | 4.9% | +0.4 | |
| softwareadvice.com | 2.6% | 0.0 | |
| semrush.com | 2.1% | +0.2 | |
| hubspot.com | 2.0% | +0.2 | |
| gartner.com | 1.7% | +0.1 | |
| producthunt.com | 0.4% | 0.0 |
Shopping
| Domain | Score | Δ pp | Leads |
|---|---|---|---|
| amazon.com | 26.8% | −0.7 | 4 |
| trustpilot.com | 23.7% | +1.8 | 2 |
| walmart.com | 18.1% | −0.1 | |
| ebay.com | 10.3% | −0.7 | |
| rtings.com | 8.3% | +0.8 | |
| cnet.com | 7.0% | −0.6 | |
| bestbuy.com | 5.8% | −0.5 |
Travel
| Domain | Score | Δ pp | Leads |
|---|---|---|---|
| tripadvisor.com | 36.6% | −0.2 | 4 |
| booking.com | 34.6% | −1.5 | 2 |
| expedia.com | 15.2% | +0.2 | |
| yelp.com | 9.2% | +0.5 | |
| lonelyplanet.com | 4.4% | +1.0 |
Press kit
If you only read three lines
- Reddit's share of ChatGPT citations fell from 28.5% to 12.1% between July and September 2026, while its share of Gemini citations rose from 27.0% to 33.6%.
- ChatGPT reshuffled 20.2 percentage points of citation share in September; Google AI Overviews reshuffled 1.2.
- Wikipedia is the single most-cited source in AI search, with 31.5% of panel citations averaged across six engines.
Quotable
“A brand that optimised for Reddit in spring got half the ChatGPT visibility it expected by autumn. The engines are not converging on one idea of a trustworthy source; they are drifting apart.”
“Google AI Overviews is the one engine where last month's citation map still works this month. Everywhere else, the ground moves every four weeks, which is why we track this monthly.”
“Copilot is quietly the most commerce-friendly engine: one in five of its citations goes to a shopping or review site. If you sell on Amazon, Copilot already knows you.”
All charts
- ai-visibility-index-key-numbers.png
- reddit-share-of-ai-citations.png
- ai-citation-turnover-by-engine.png
- ai-citation-sources-by-type.png
- chatgpt-citation-sources-by-month.png
- most-cited-sources-in-ai-search.png
- ai-engine-top-10-overlap.png
- ai-citation-concentration-top-3.png
- niche-citation-turnover-by-engine.png
See which sources AI cites for your brand
The index tracks 52 big domains. AskWatch tracks your prompts, your competitors and the pages that decide your answers.
- No credit card required.
- Result in a few minutes.